
Hi, I'm Laura, I'm a 5th generation Okie whose family has lived in the state pre-landrun. I like learning the history and culture of my state and how that can be translated geographically.
I enjoy mapping remote locations and teaching others about how to utilize GIS to benefit their local communities.
I have a B.S. in Geography and a secondary major in Natural Resources and Environmental Sciences from Kansas State University. I have a master in Cartography specalizing in GIS and Web Map Programming from the University of Wisconsin – Madison.
Do you have a project you need help crafting into a finished product? I would love to hear more.

As a member of Cherokee Nation I became inspired by The Cherokee Language Revitalization initiative. The initiative set out with the goal to keep the language and syllabary not just alive, but thriving and fluently spoken within the tribe. However I noticed that I could not find a map of Cherokee Nation written in Cherokee. As a result I was excited to create this map to give back to the community that is so important to my family and I.
Close Project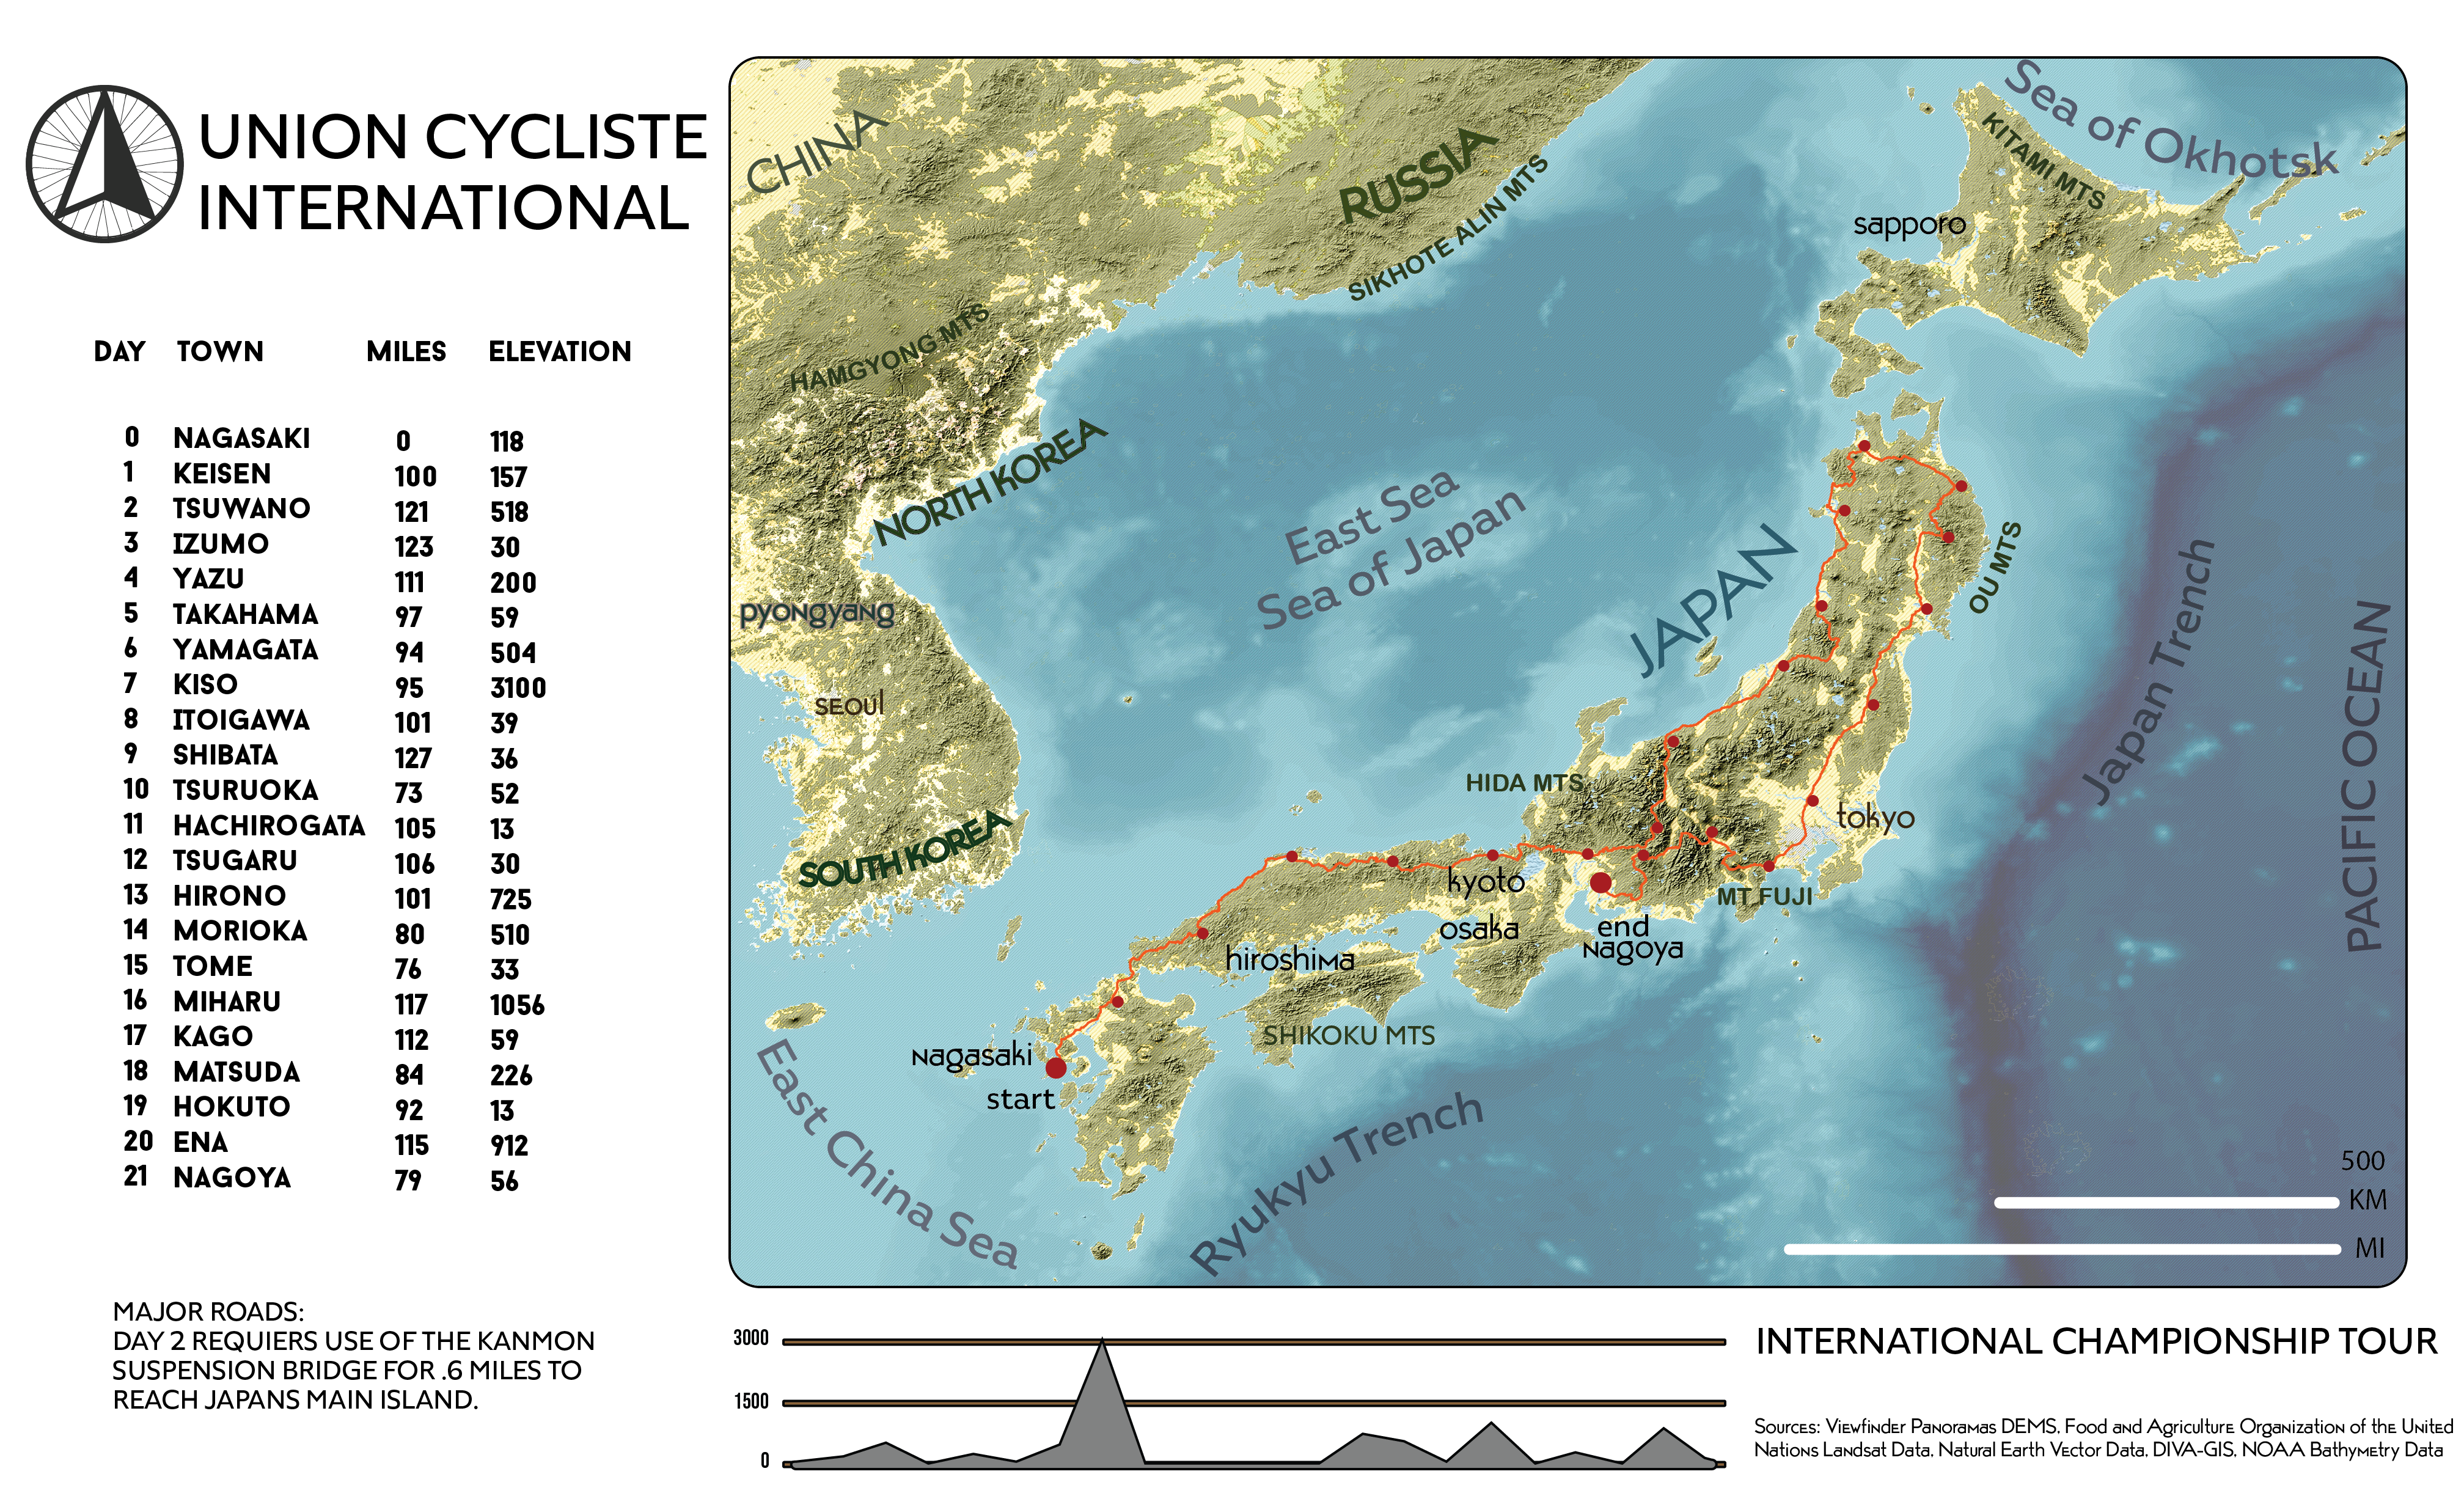
This map was created as a project for my master’s program. The objective was to plan a 21 day bike race and display the course on a detailed terrain map.
Close Project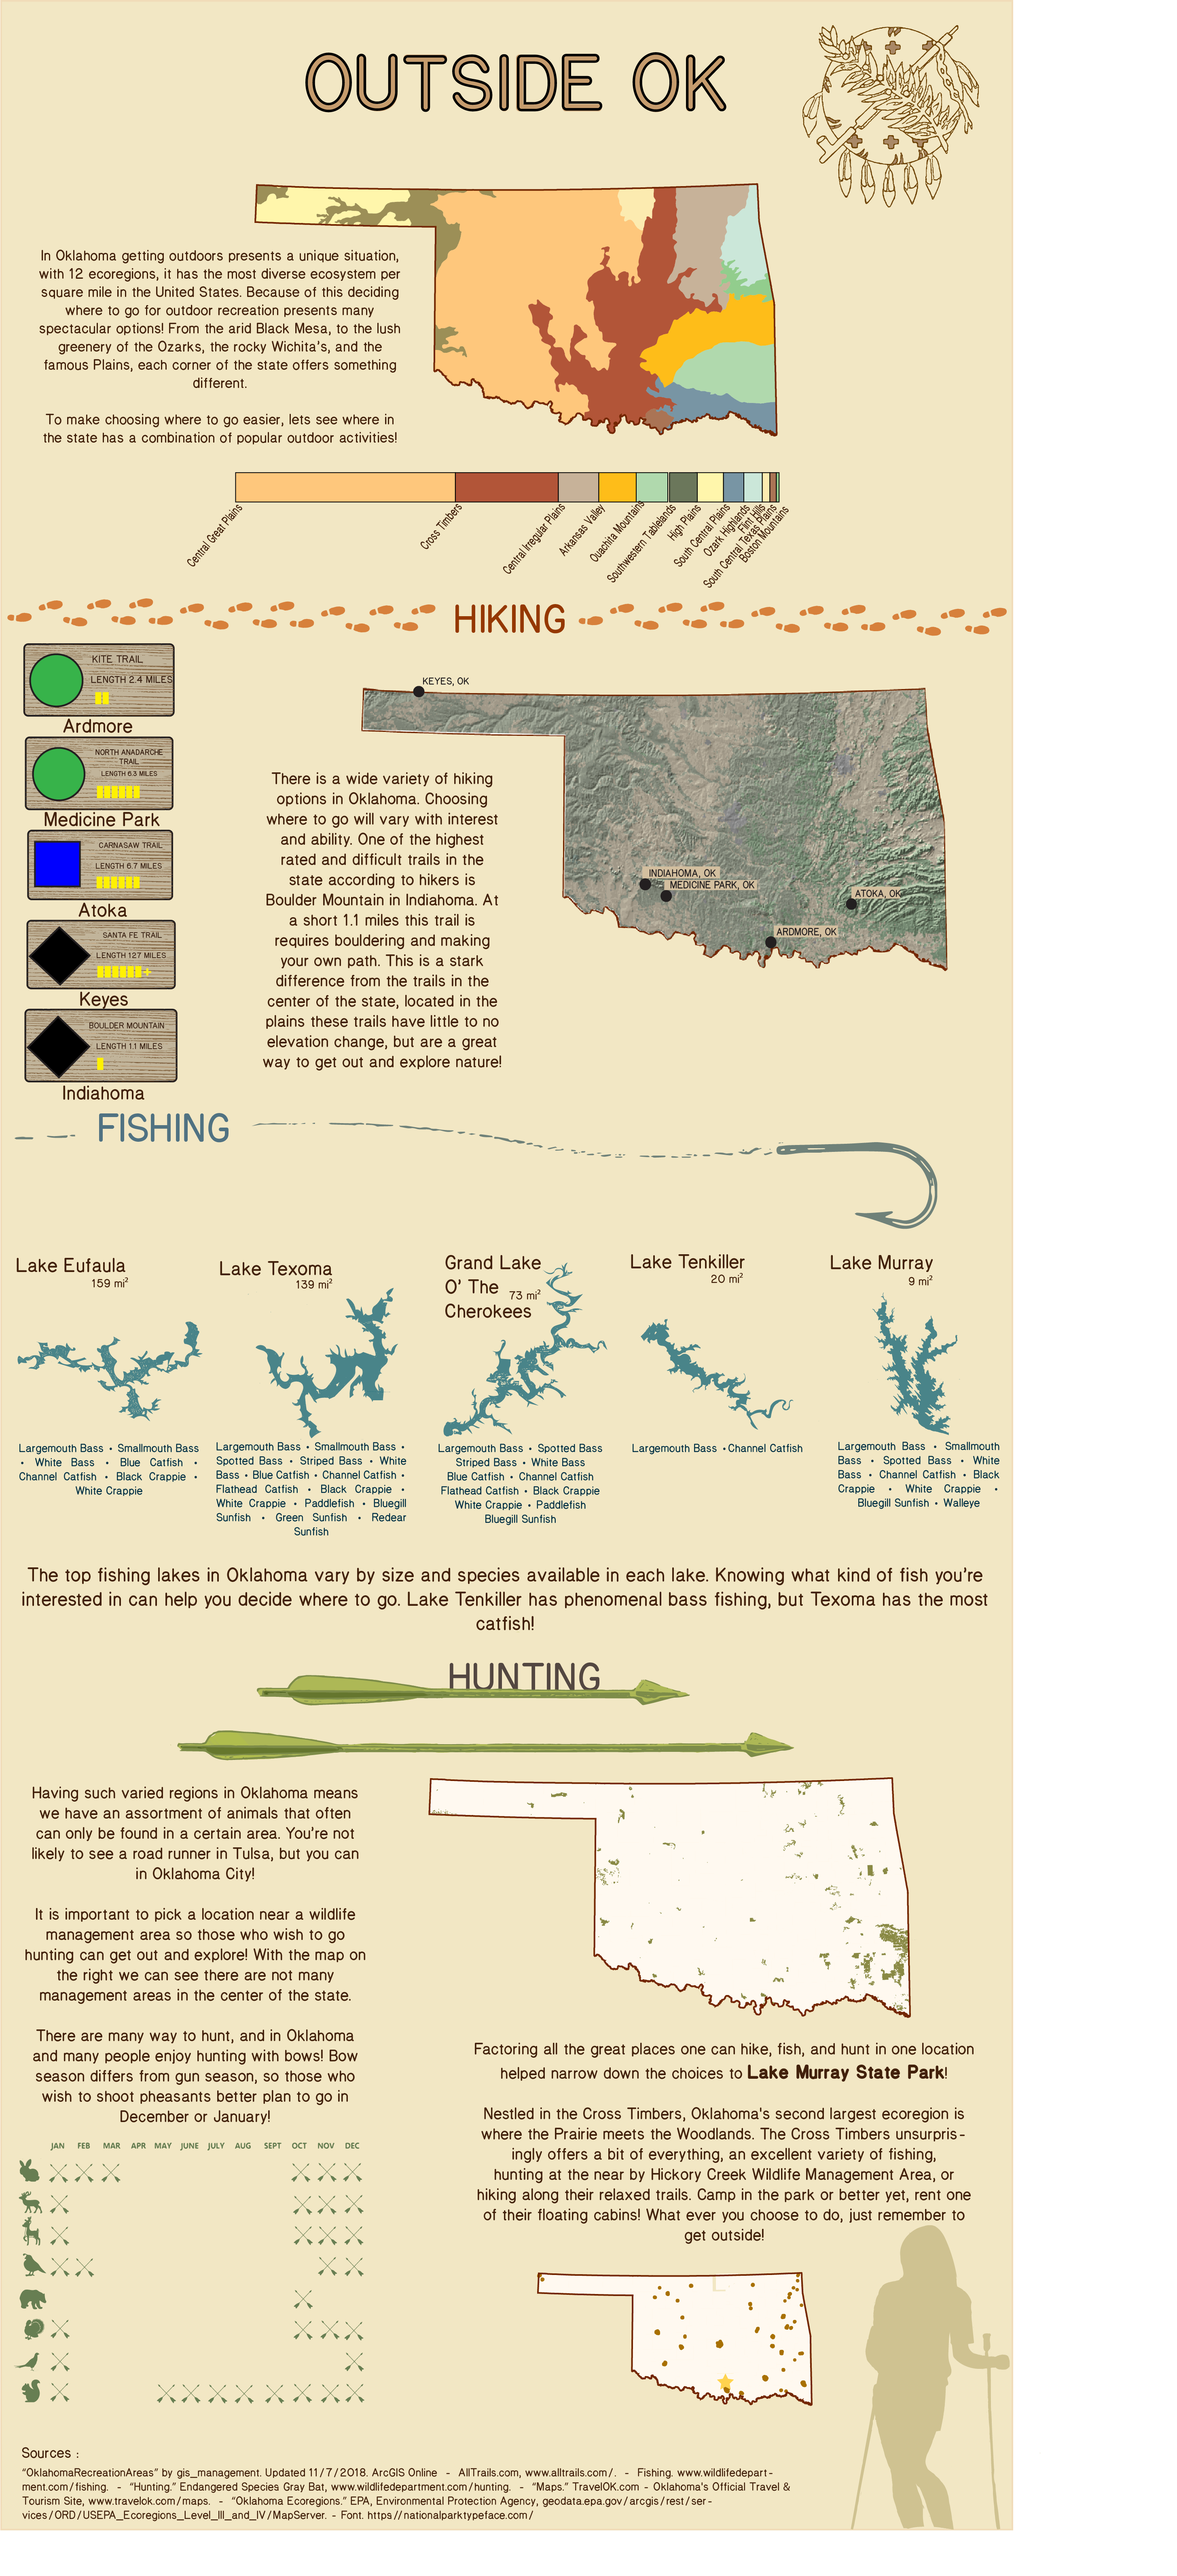
Oklahoma has many natural amenities to offer, and spending time outdoors is common for those that live here. This infographic allowed me to highlight the level of eco diversity in OK that is generally unknown to those who have never been here. While at the same time talk about the different features at each location that might appeal to a varied group of people.
Close Project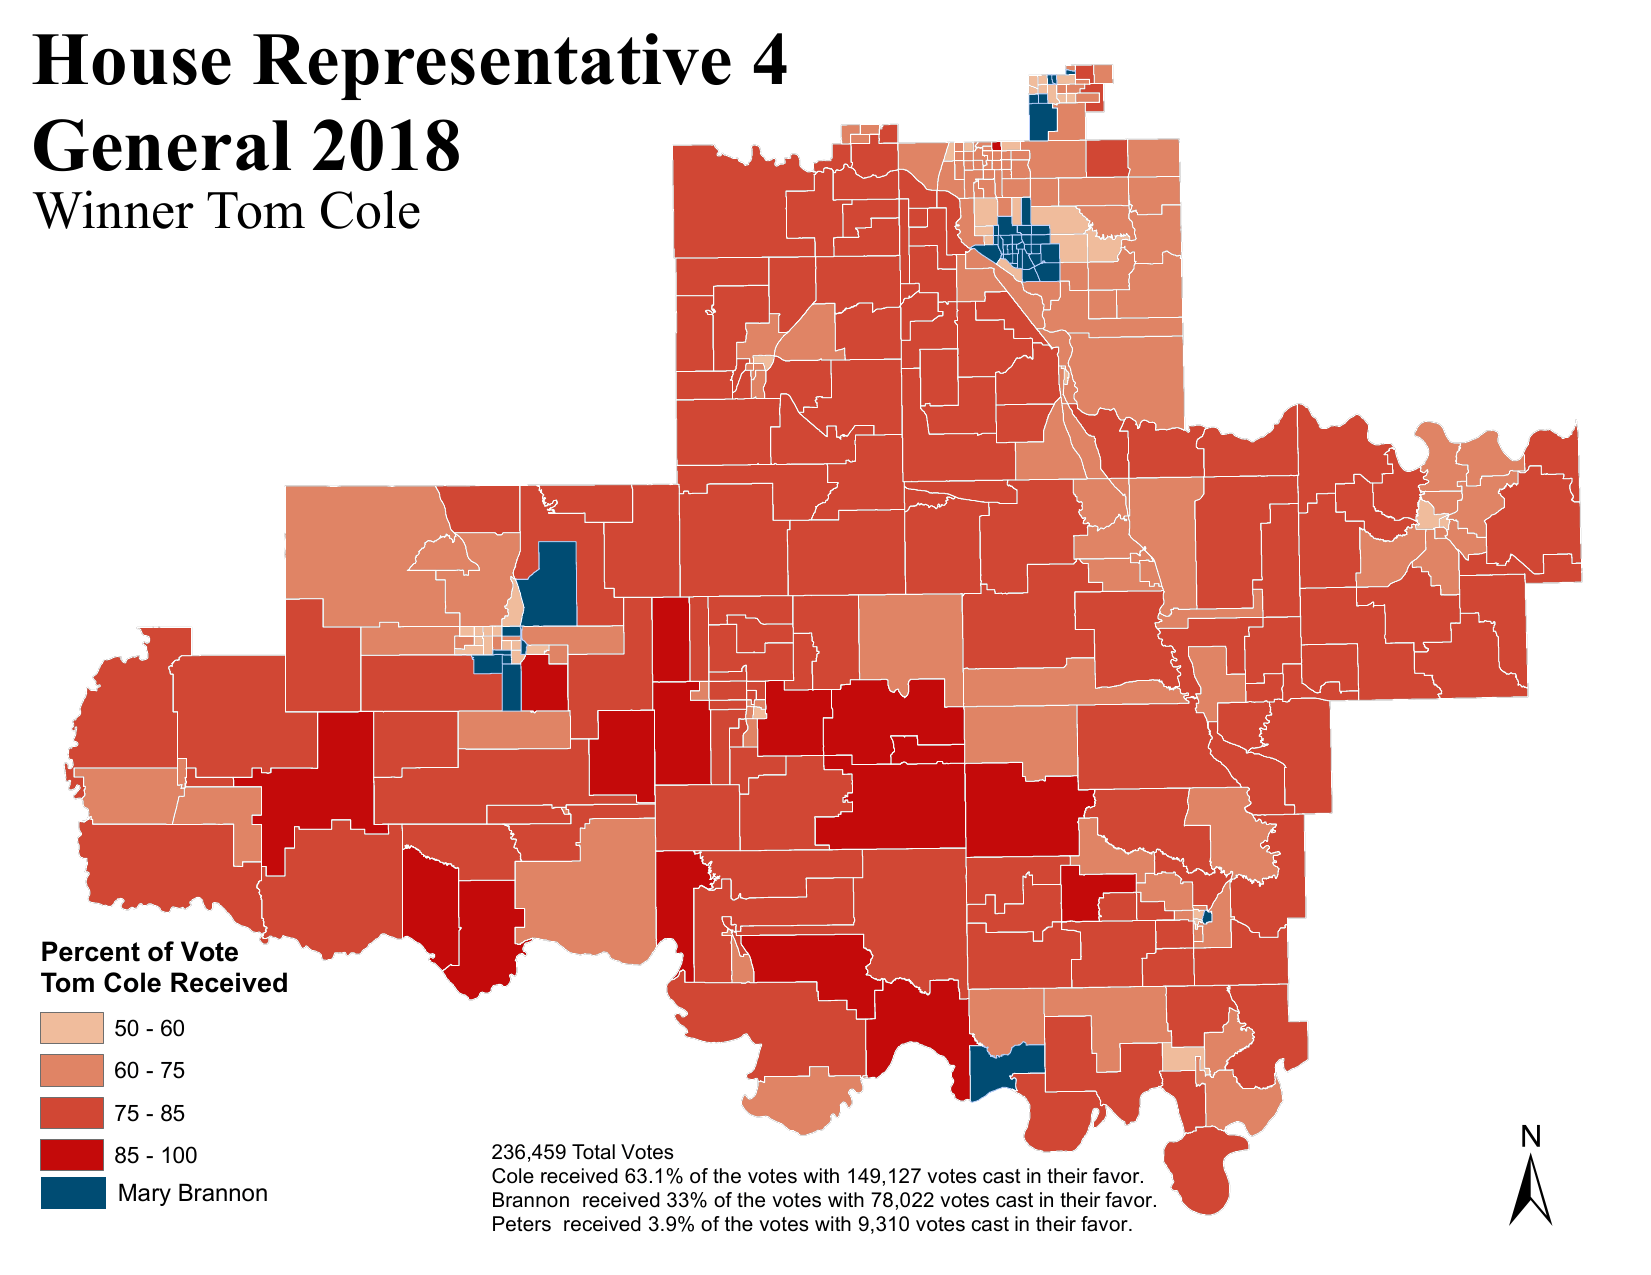
At my job I am in charge of generating election maps for districts that touch Cleveland County, OK.
Close Project
I have incorporated CityEngine into my work with the Cleveland County Courthouse. In the next few years the courthouse will be undergoing many redevelopments. With 3D rendering it gives our officals and constituants a chance to see what the development will look like when complete.
Close ProjectThis map was generated for a member of the Cleveland County, OK health department who works with veterans. By utilizing census data I was able to show my coworker which Census tracks have the highest concentration of disabled veterans. With this information he is now able to better asses which areas in the county need his help most.
Close ProjectIn 2015 Oklahoma had received a particularly wet storm season. These rains had undone years’ worth of drought and saturated the ground leading to flash flooding. As the rain continued it was determined that the dam on our local lake would be released if it did not stop raining in the next few hours. This prompted the issue of what homes would need to be evacuated. This map was generated for the sheriff’s office to insure all residents that might potentially be impacted by the flood were evacuation. Luckily it did not have to be used.
Close Project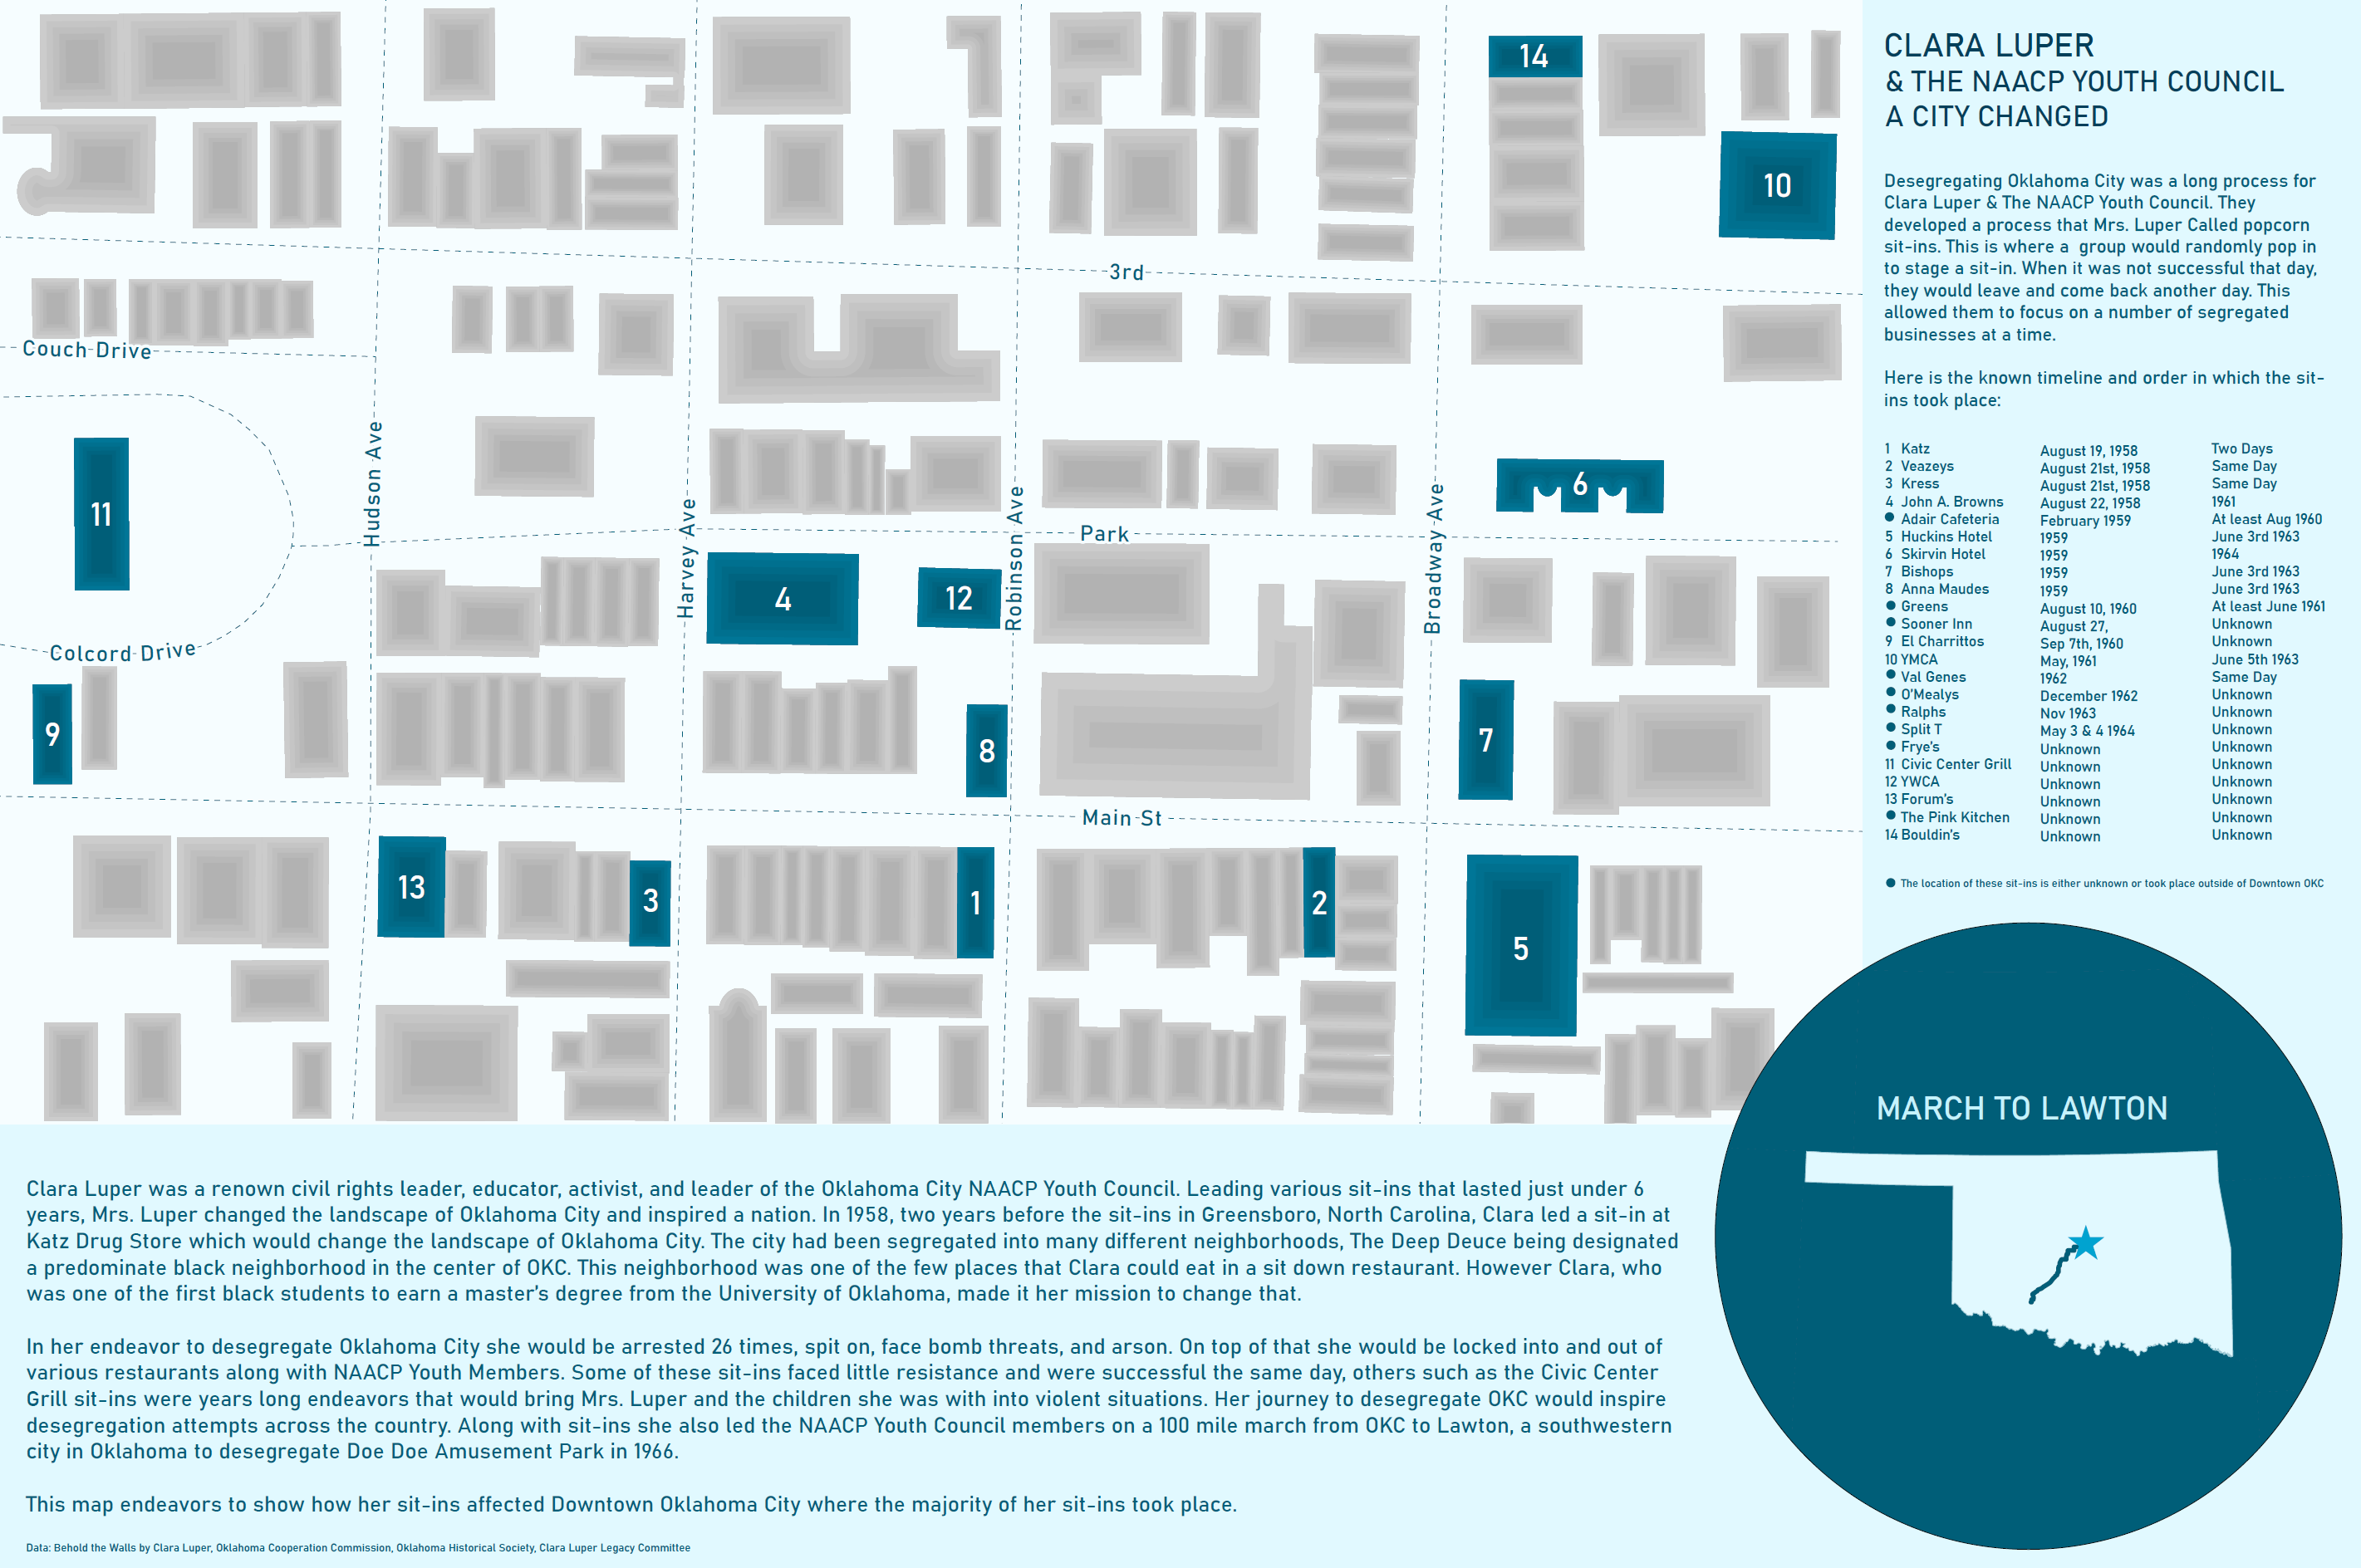

Clara Luper was a civil rights leader from Oklahoma that desegregated downtown Oklahoma City restaurants and cafeterias through sit-ins. This series of protest would last six years and go on to inspire a movement across the nation. A decade later most of Downtown would be demolished in an attempt to revitalize this area, and these resturants would be torn down. Creating this map was a research project through aerial photography and historical documents that would help me learn where and when these sit ins took place. Learn more about Clara Luper in this storymap.
Close ProjectSpring time in Oklahoma brings severe weather and wildflowers. While there are hundreds of different types that grow in different corners of the state, I have picked a dozen of the most common and beloved from across the state that will give an idea of where these blooms can be found.
Close Project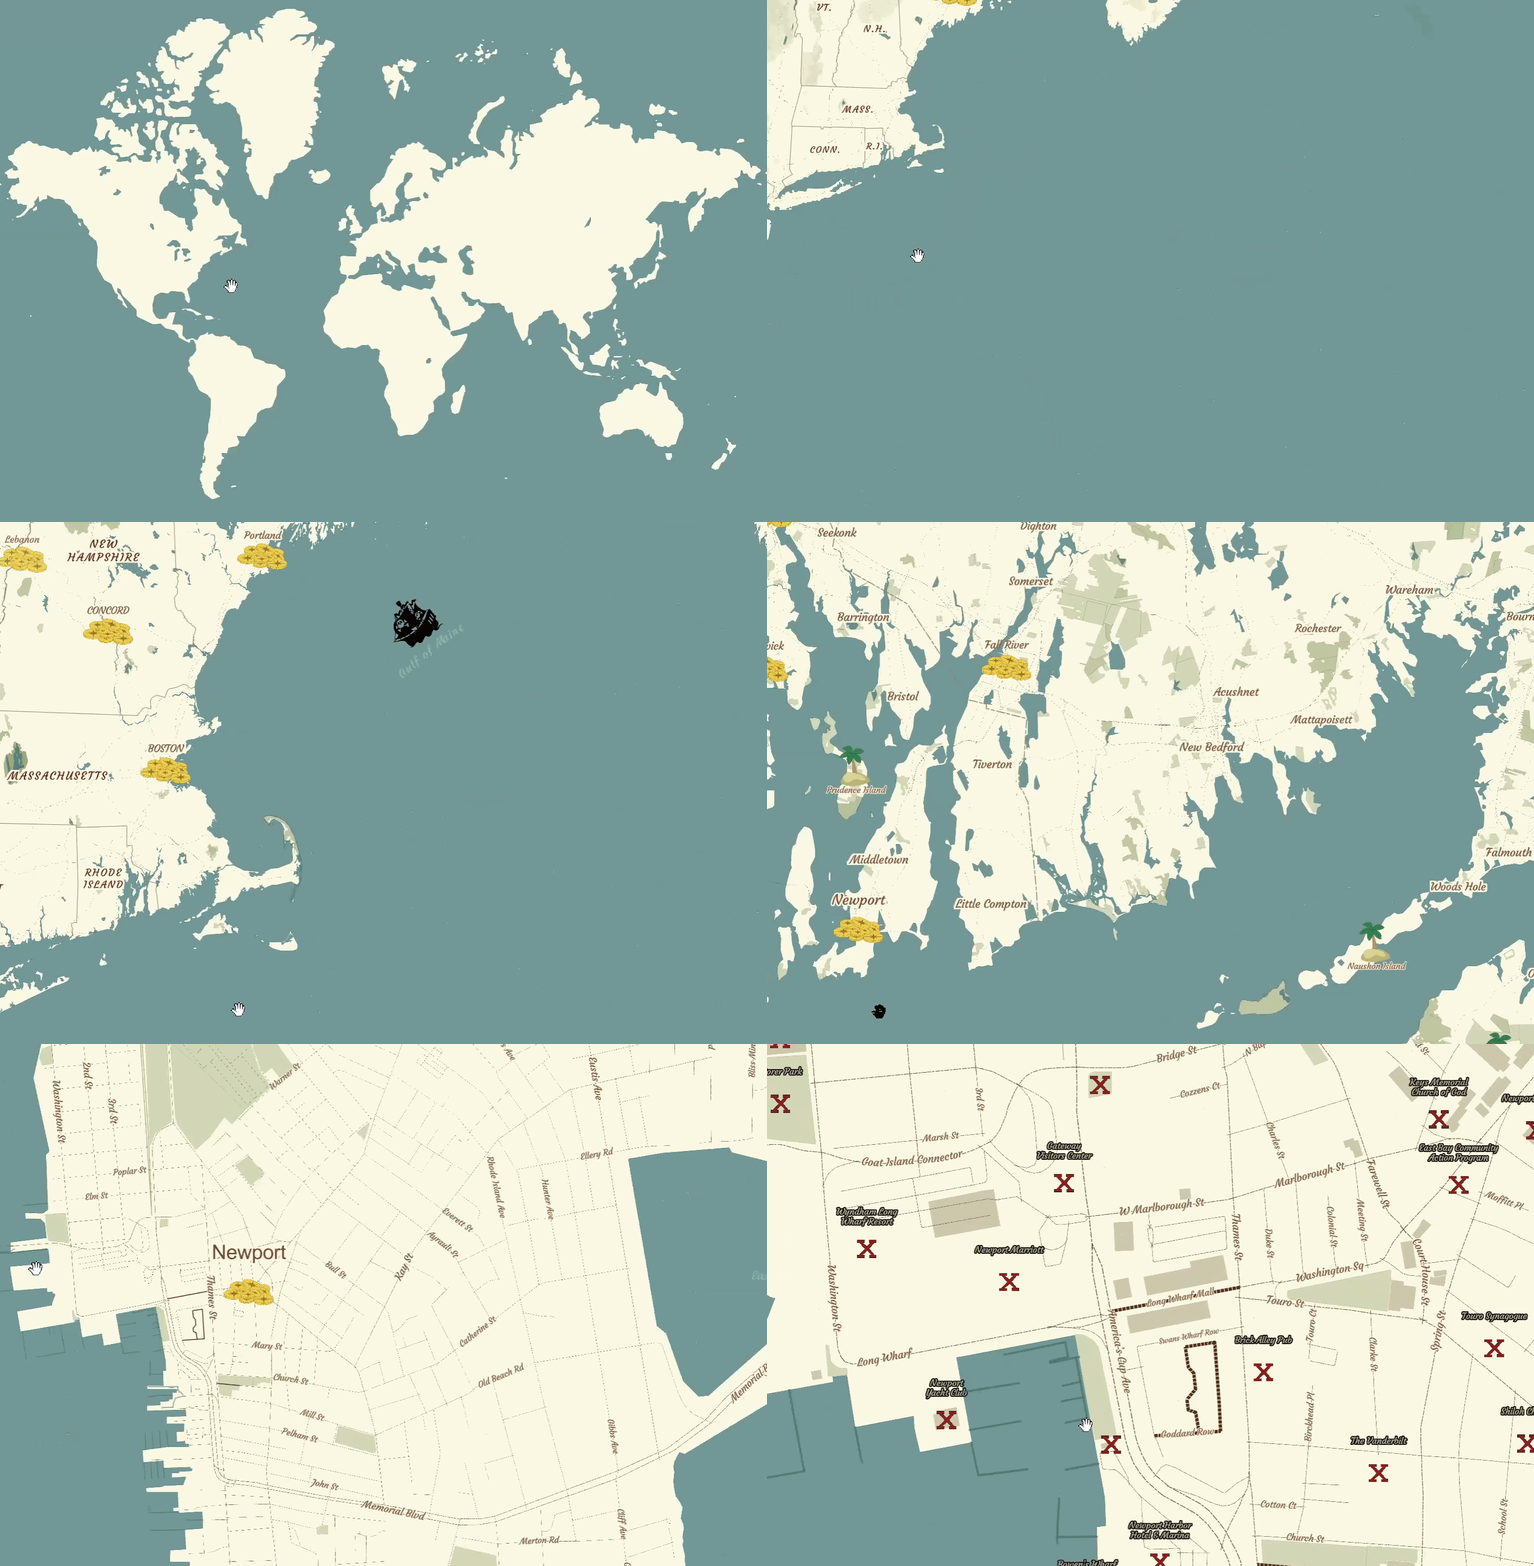
These map tiles were created though Mapbox for my graduate progam. I was particularly excited about this project because it is not every day that a cartographer gets to create a pirates map! You can view the full verson of my Peter Pan themed tiles and play along with a geographical game by visiting Neverland here: Visit Tiles
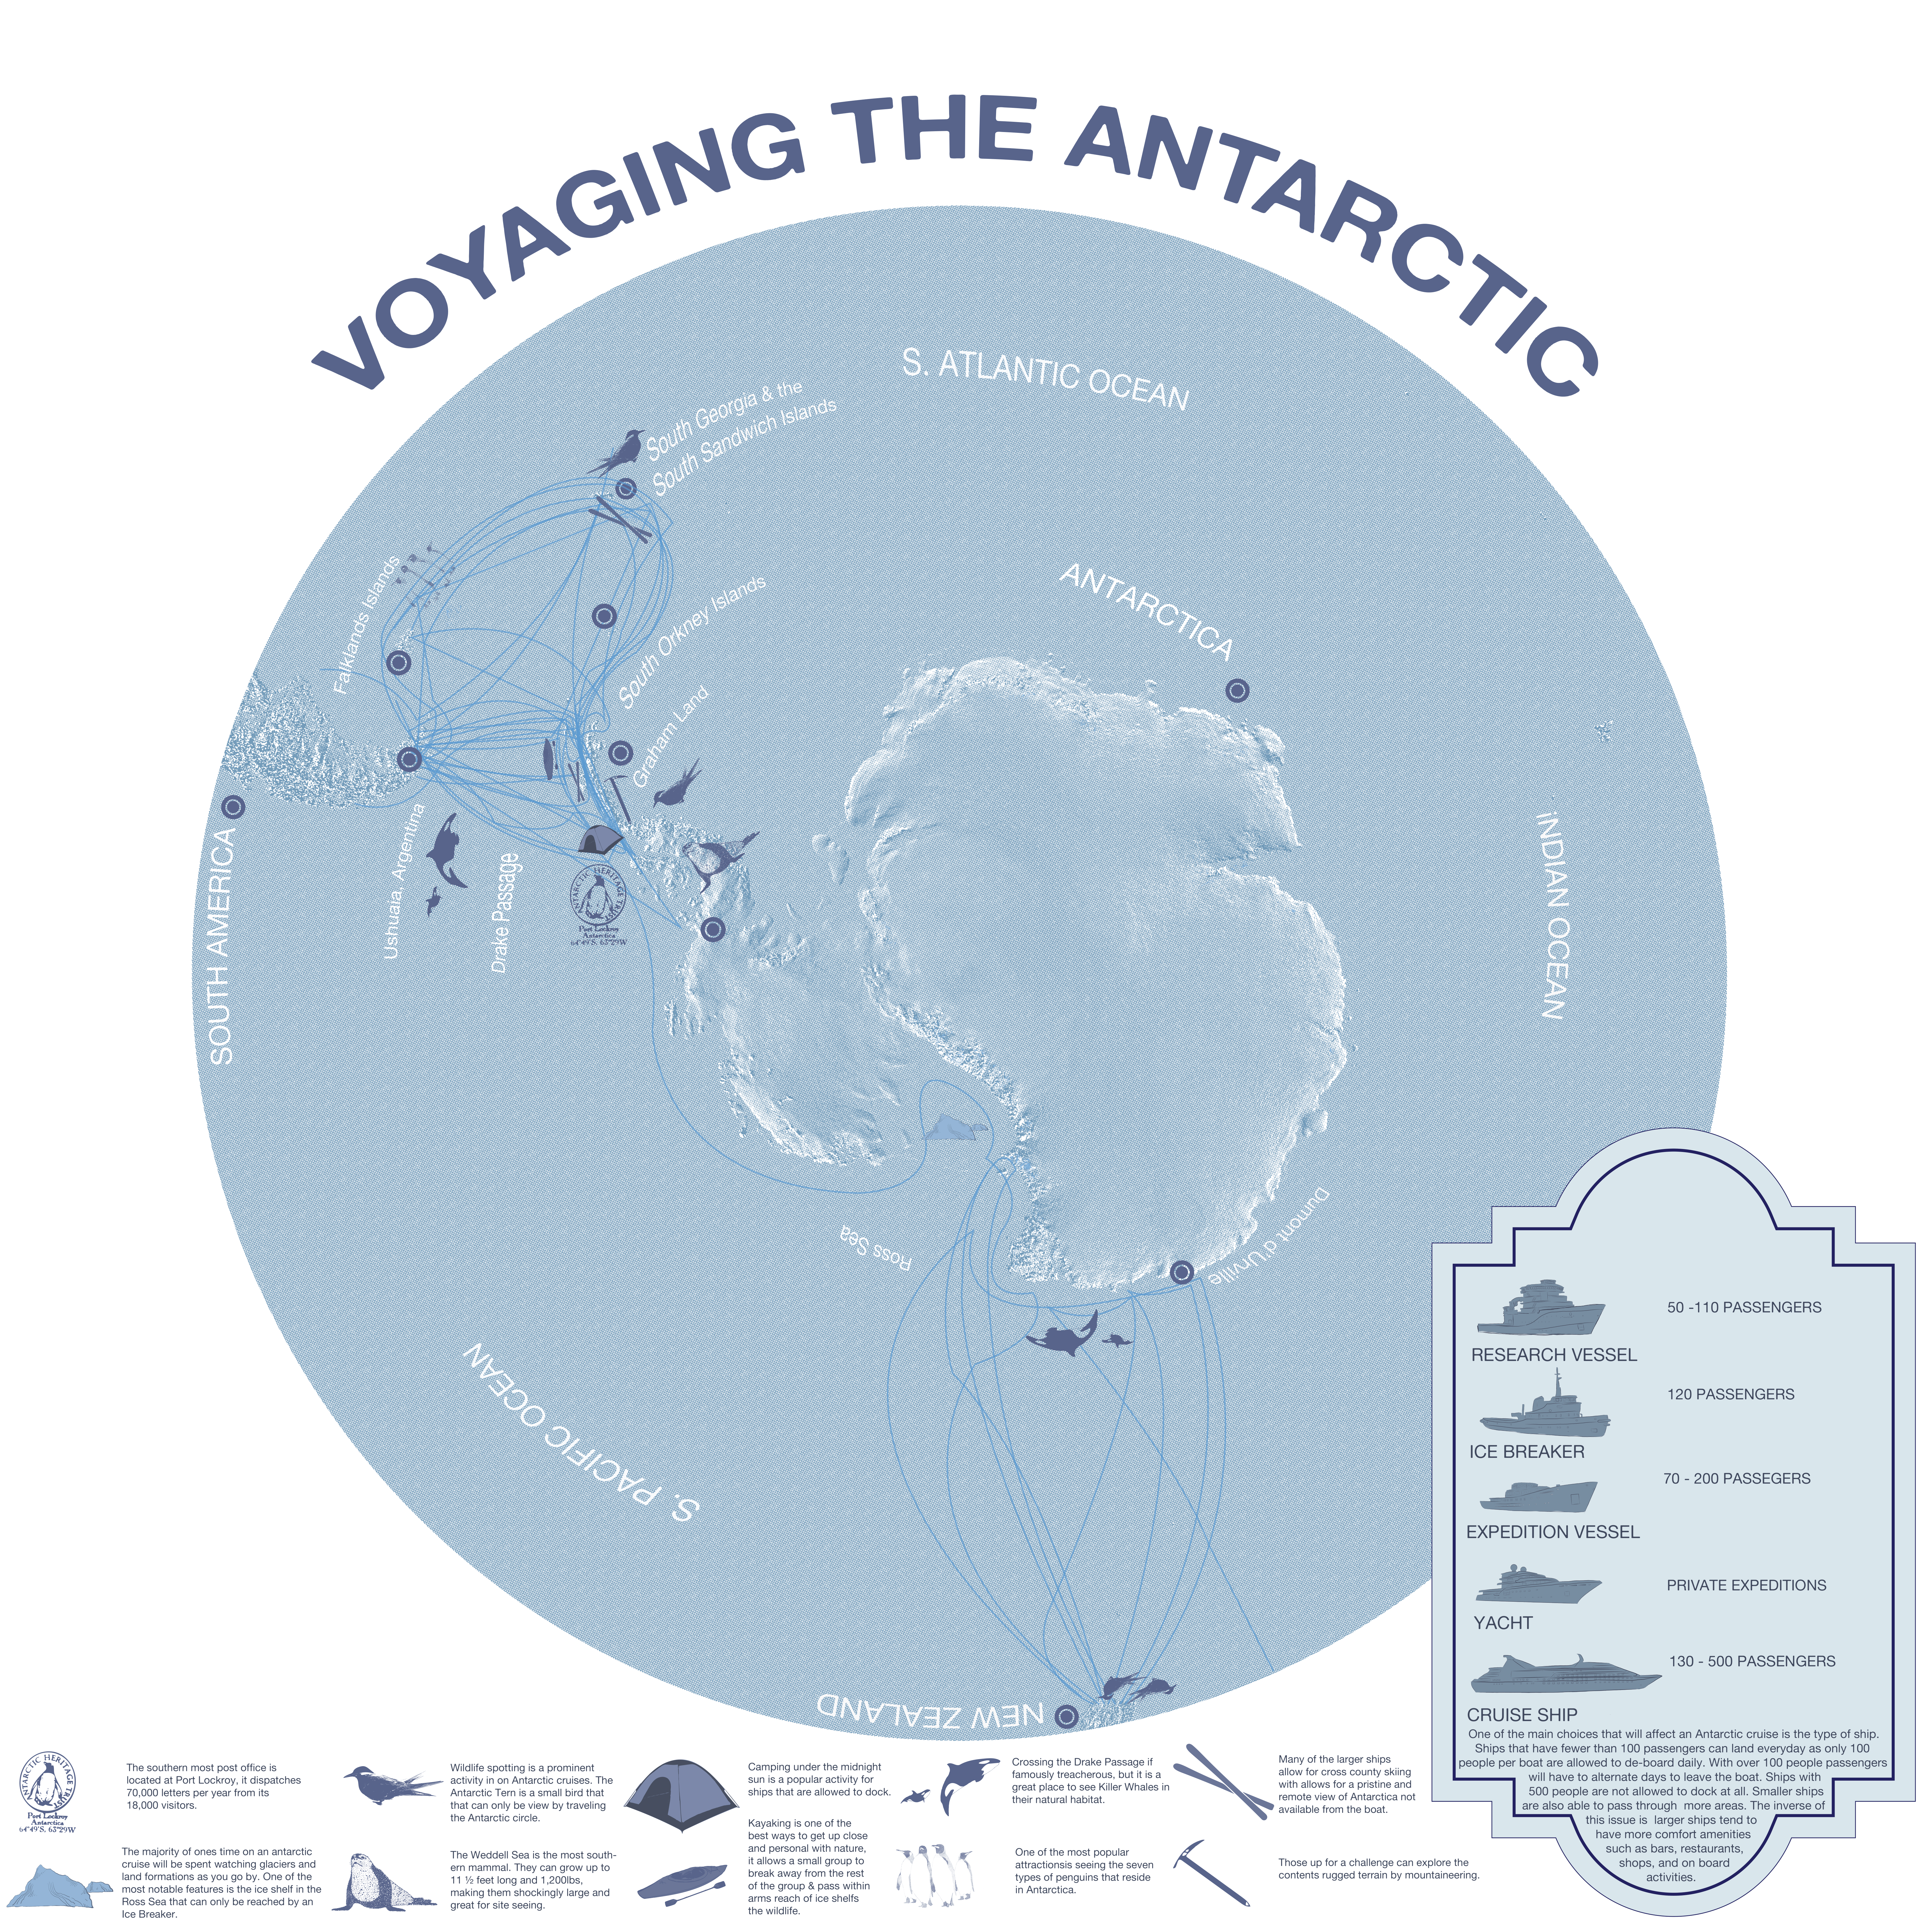
I have always been interested in remote places. Tourism of the worlds most desolate locations is both facinating and paradoxical. This map explores where various crusie ships visit in Antarctica and what one might expect to do while visiting.
Close Project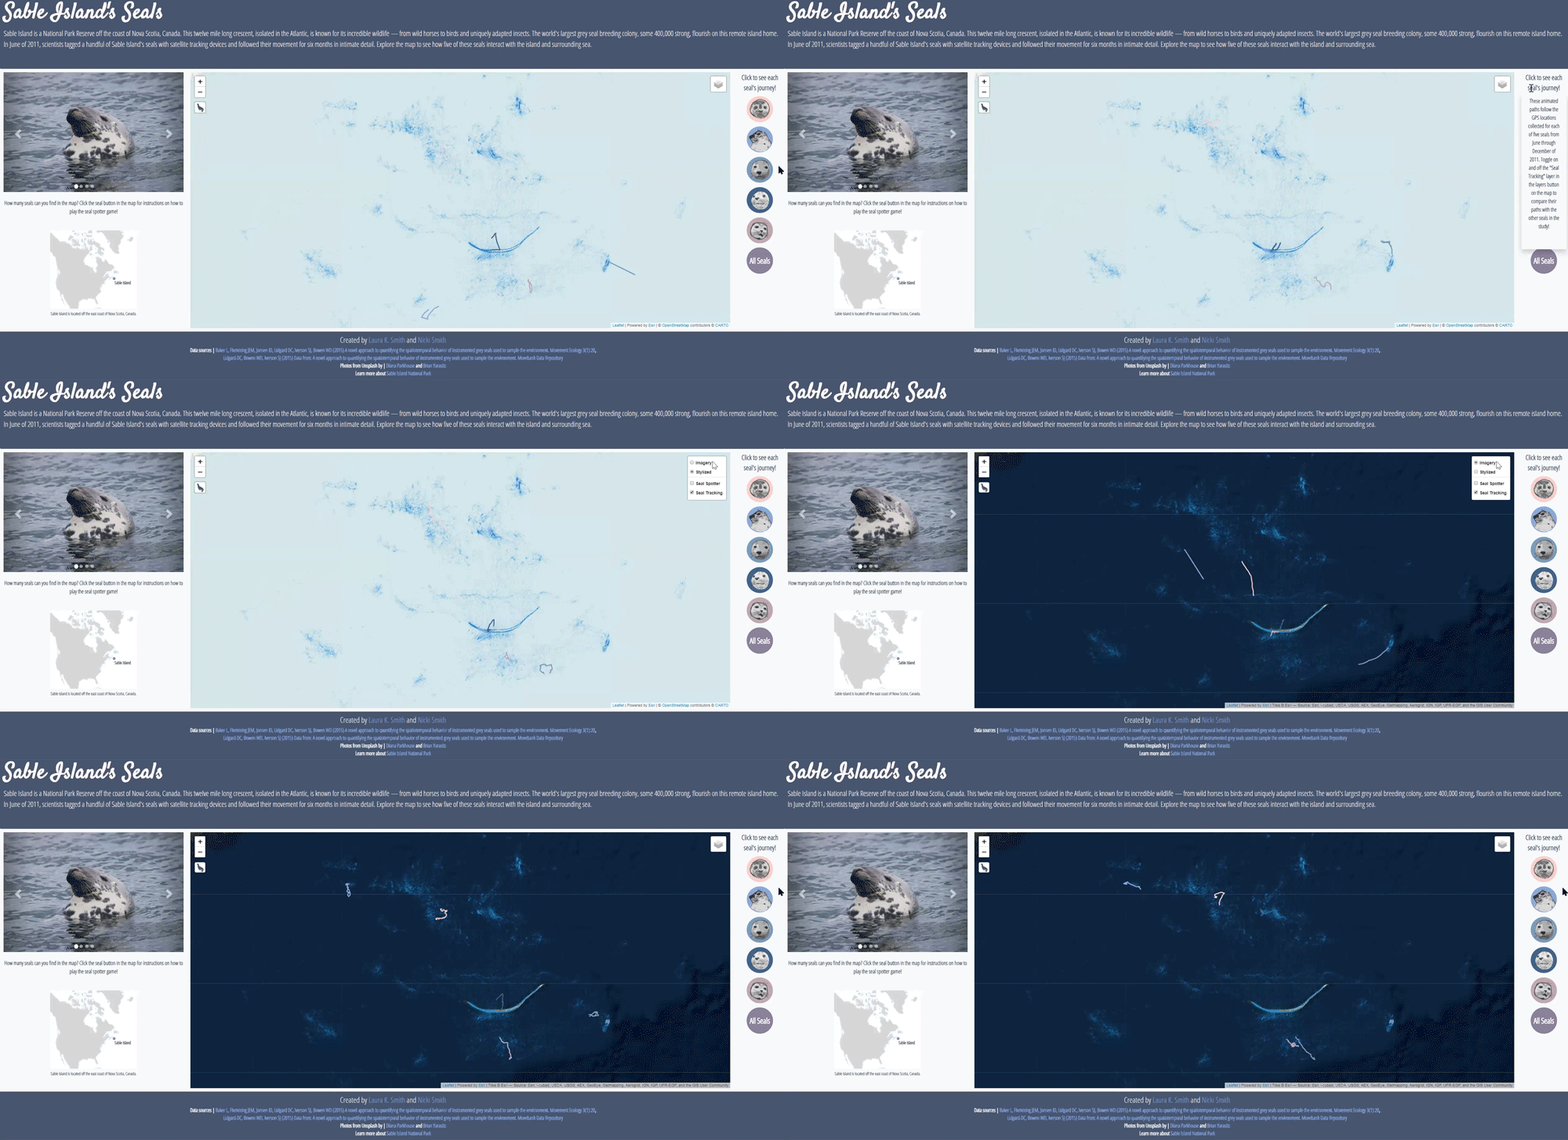
This projest was creates as part of a full stack development project. Parsing data to show five seals as they travel around the Sable Island National Park Reserve. Creating this website has been one of my favorite projects to date. From concept design, to codeing & illustrating this project was exciting every step of the way. This project was created in collaboration with Nicki Smith.
Close ProjectThis project was creatded in Leaflet and explores how the communities along the Mississippi river have prospered and shrunk as trade along the Mississippi River thrived and faltered.
Close ProjectVoter registration is a complicated topic, that is often a point of contention. With this D3 project I attempted to break down registration percentages by county to see which areas of Oklahoma saw the most change.
Close ProjectI love when I get the chance to combine my hobbies. Recently a friend of mine had a baby and I did not have the time to make her a quilt. She mentioned wanting to decorate the nursery with a few maps. This was great news to me! It gave me the chance to flex my creative muscles and create these quilty maps that focus on the geography that is important to her and her family.
Close Project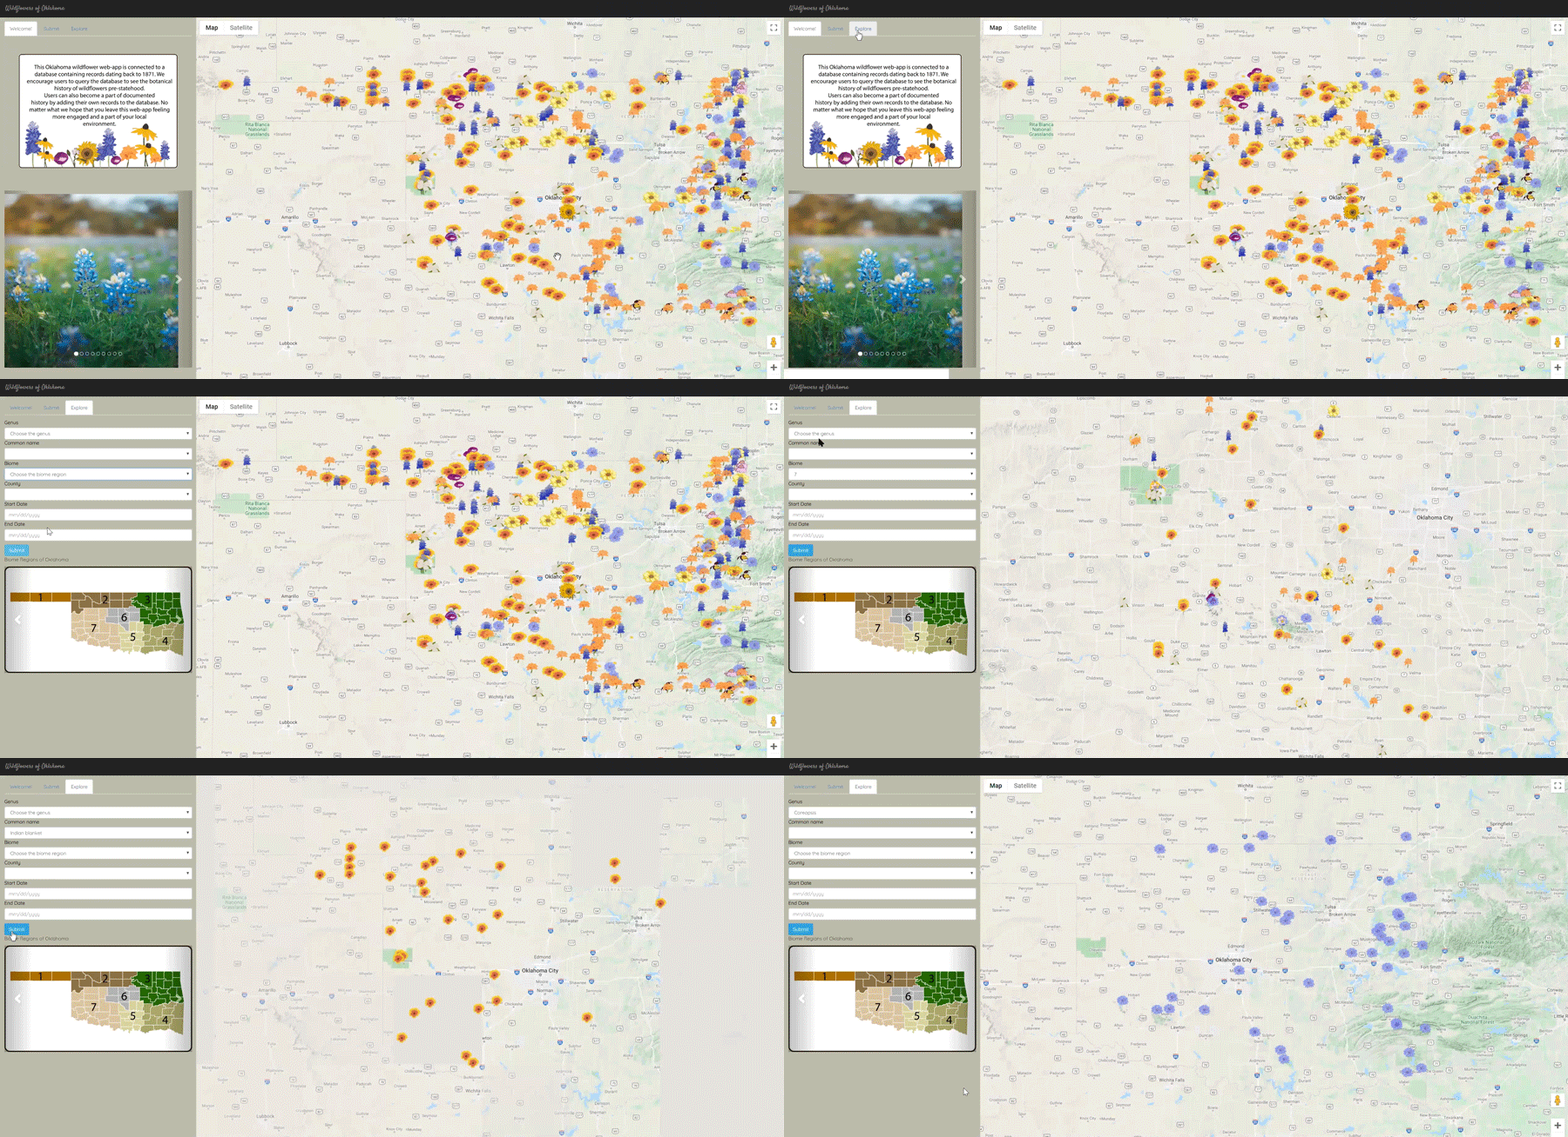
My love of native flowers and grasses led me to expanding my static Wildflowers of Oklahoma map into a functional webapp with the help of Nicki Smith. Built on a database from TORCH we were able to map wildflower sightings back to 1870. This webapp showcases the 12 most prolific genera of wildflowers recorded in the database. With this data you are able to dynamically search based on date, genus, common name, county, or region. It is also configured to record new wildflower sightings. If you want to explore the data or add a wildflower sighting please visit here: Oklahoma Wildflowers
Close ProjectThe Happy Hive Project was my final project before graduating with my masters in cartography for the University of Wisconsin-Madison. It started as an interactive webapp where people can report what types of plants they grow to support pollinators in their local area and bloomed into a full page infographic style webpage. Utilizing Java, Javascript, SQL, D3, Leaflet, html5, imagemaps, and a boat load of charts, graphs, and styling this project embraced the concept of full stack development. This webpage leads the user from the problem of loss of pollinators, teaches them about the wide diversity of bees in North America, and leaves them with the knowledge of how to help their community support the bees.
Close ProjectMaking decisions should always starts on a foundation of knowledge. GIS plays an important role in informing people of trends and patterns. This map was created to bring attention to one of the smaller state parks in Oklahoma. Knowing the depth of the lake shows why certain parts of the lake have been developed while others are sparse. With the help of this map community leaders are able to envision how Lake Thunderbird should be developed and renovated for future generations.
Close Project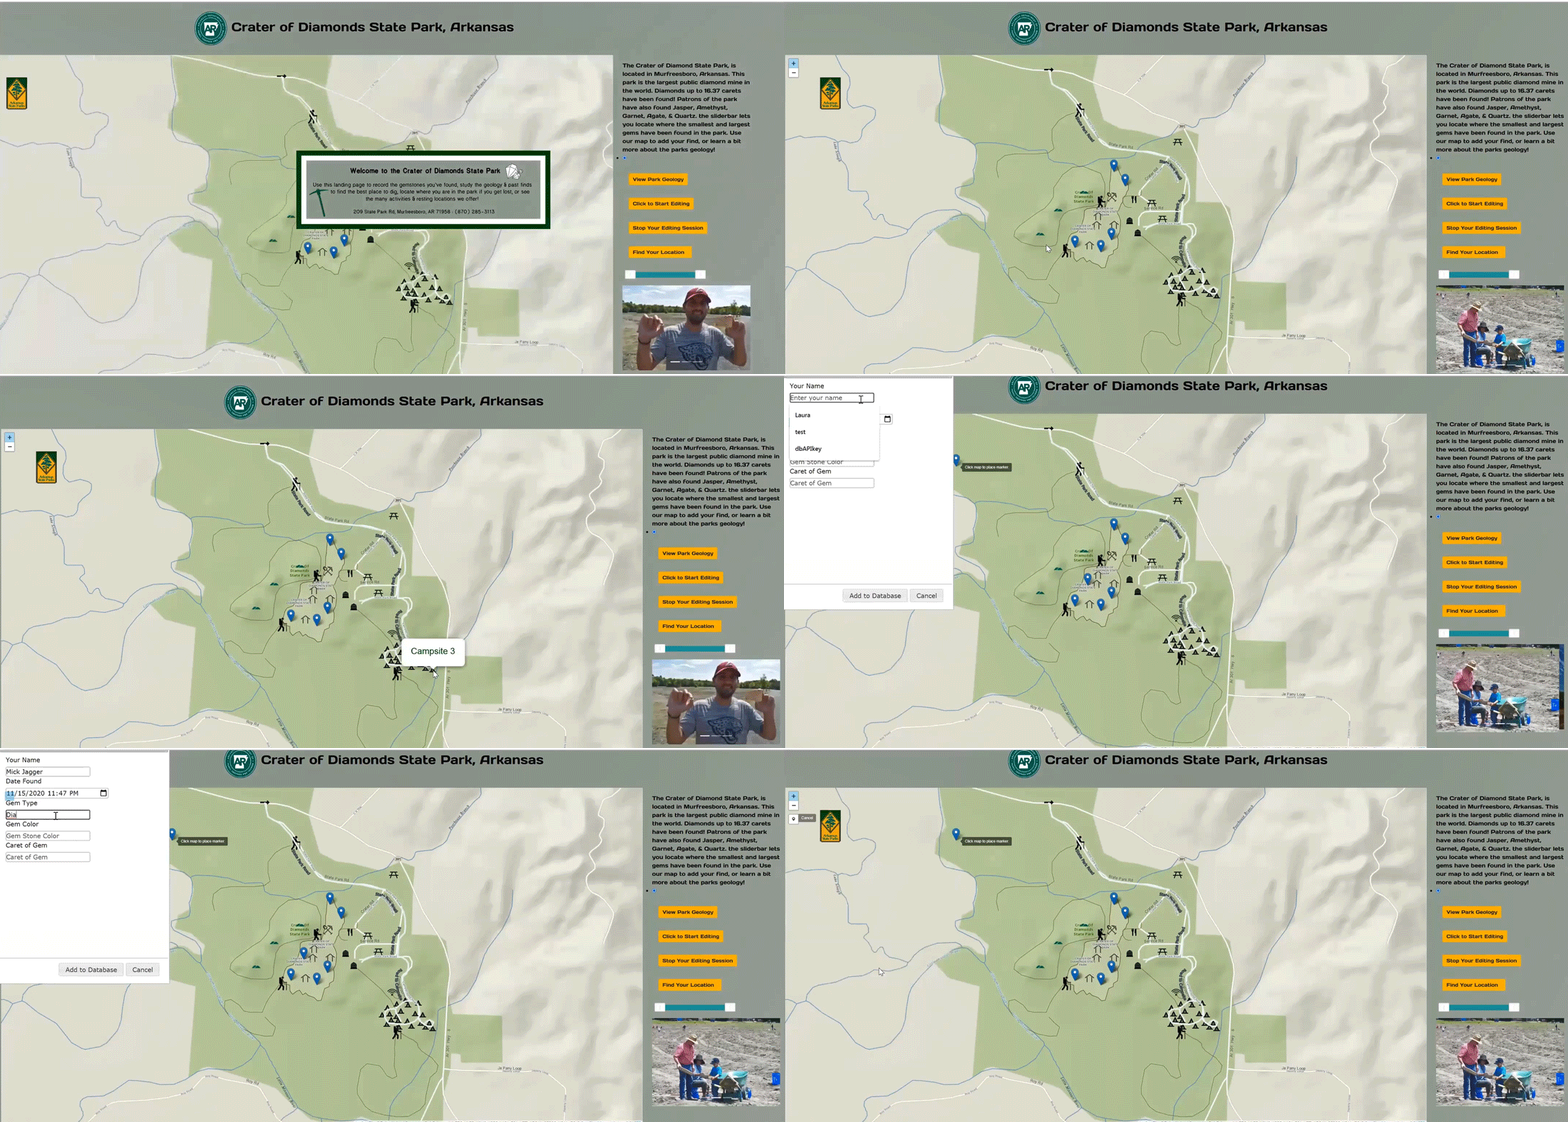
For my capstone course at UW we were assigned to make a webpage centered around a state park. I chose the Crater of Diamonds State Park in Arkansas. This park website allows the users to record the gemstones they found in the park, locate park features, filter gemstone records by gem size, find their location on the map, and explore park geology.
Close Project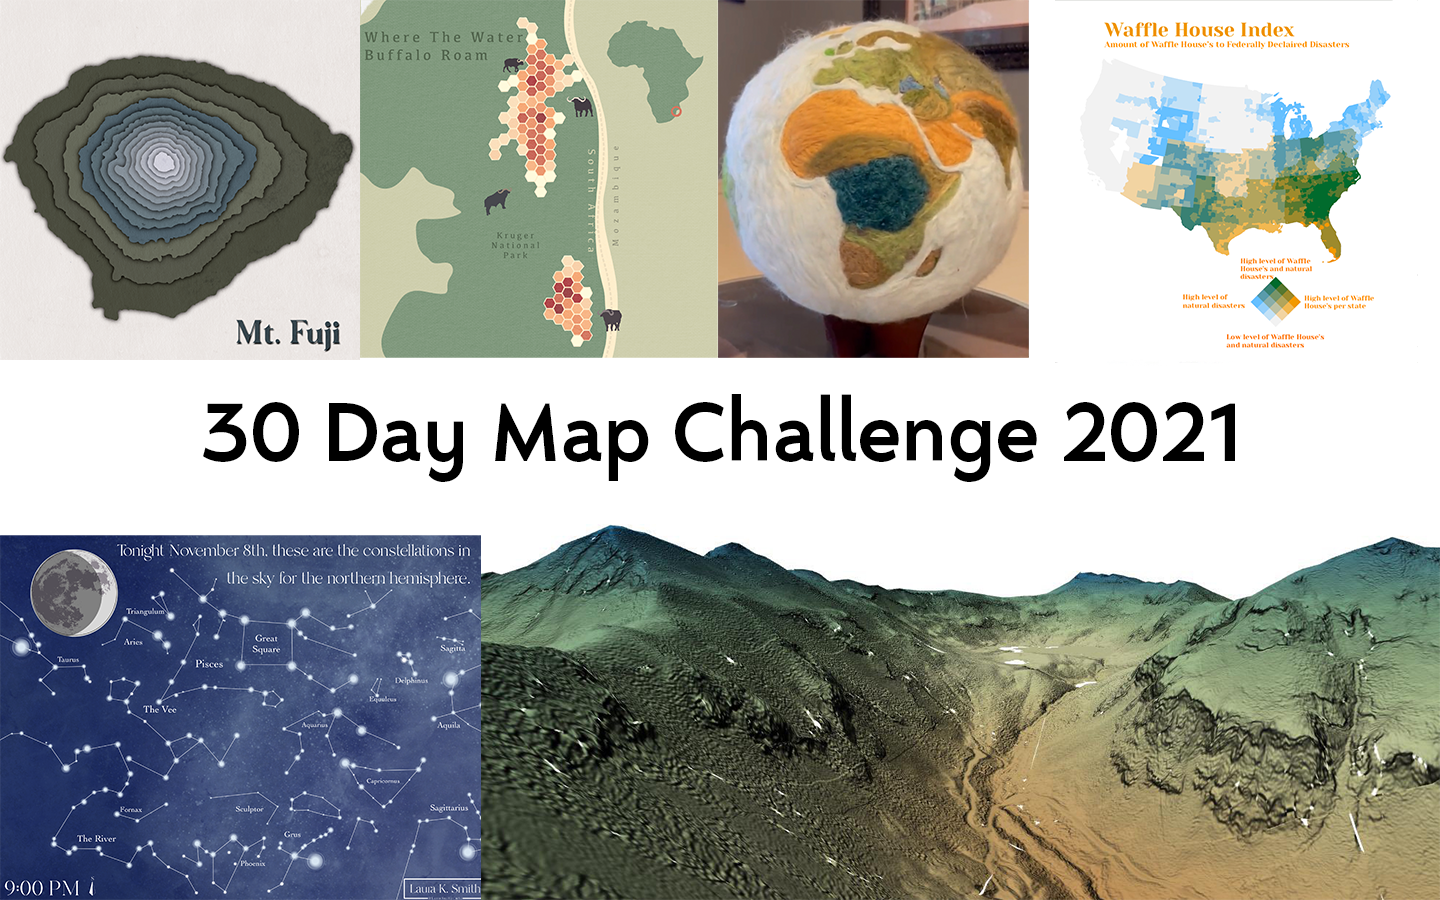
The 30 Day Map Challenge is an opportunity for cartographers to create a map every day for 30 days. Each day is assigned a specific topic that the map has to relate to. I participated in 2021 and my maps can be found on my twitter. I embraced this map a day challenge as a way to not only test my skills at making quick maps look nice, but as a chance to create maps I had started but had run into a roadblock completing. This allowed me to find map ideas that were worth continuing and maps that needed to be reworked. Some of these maps were hits, some were misses, but I learned something creating each of them.
Close Project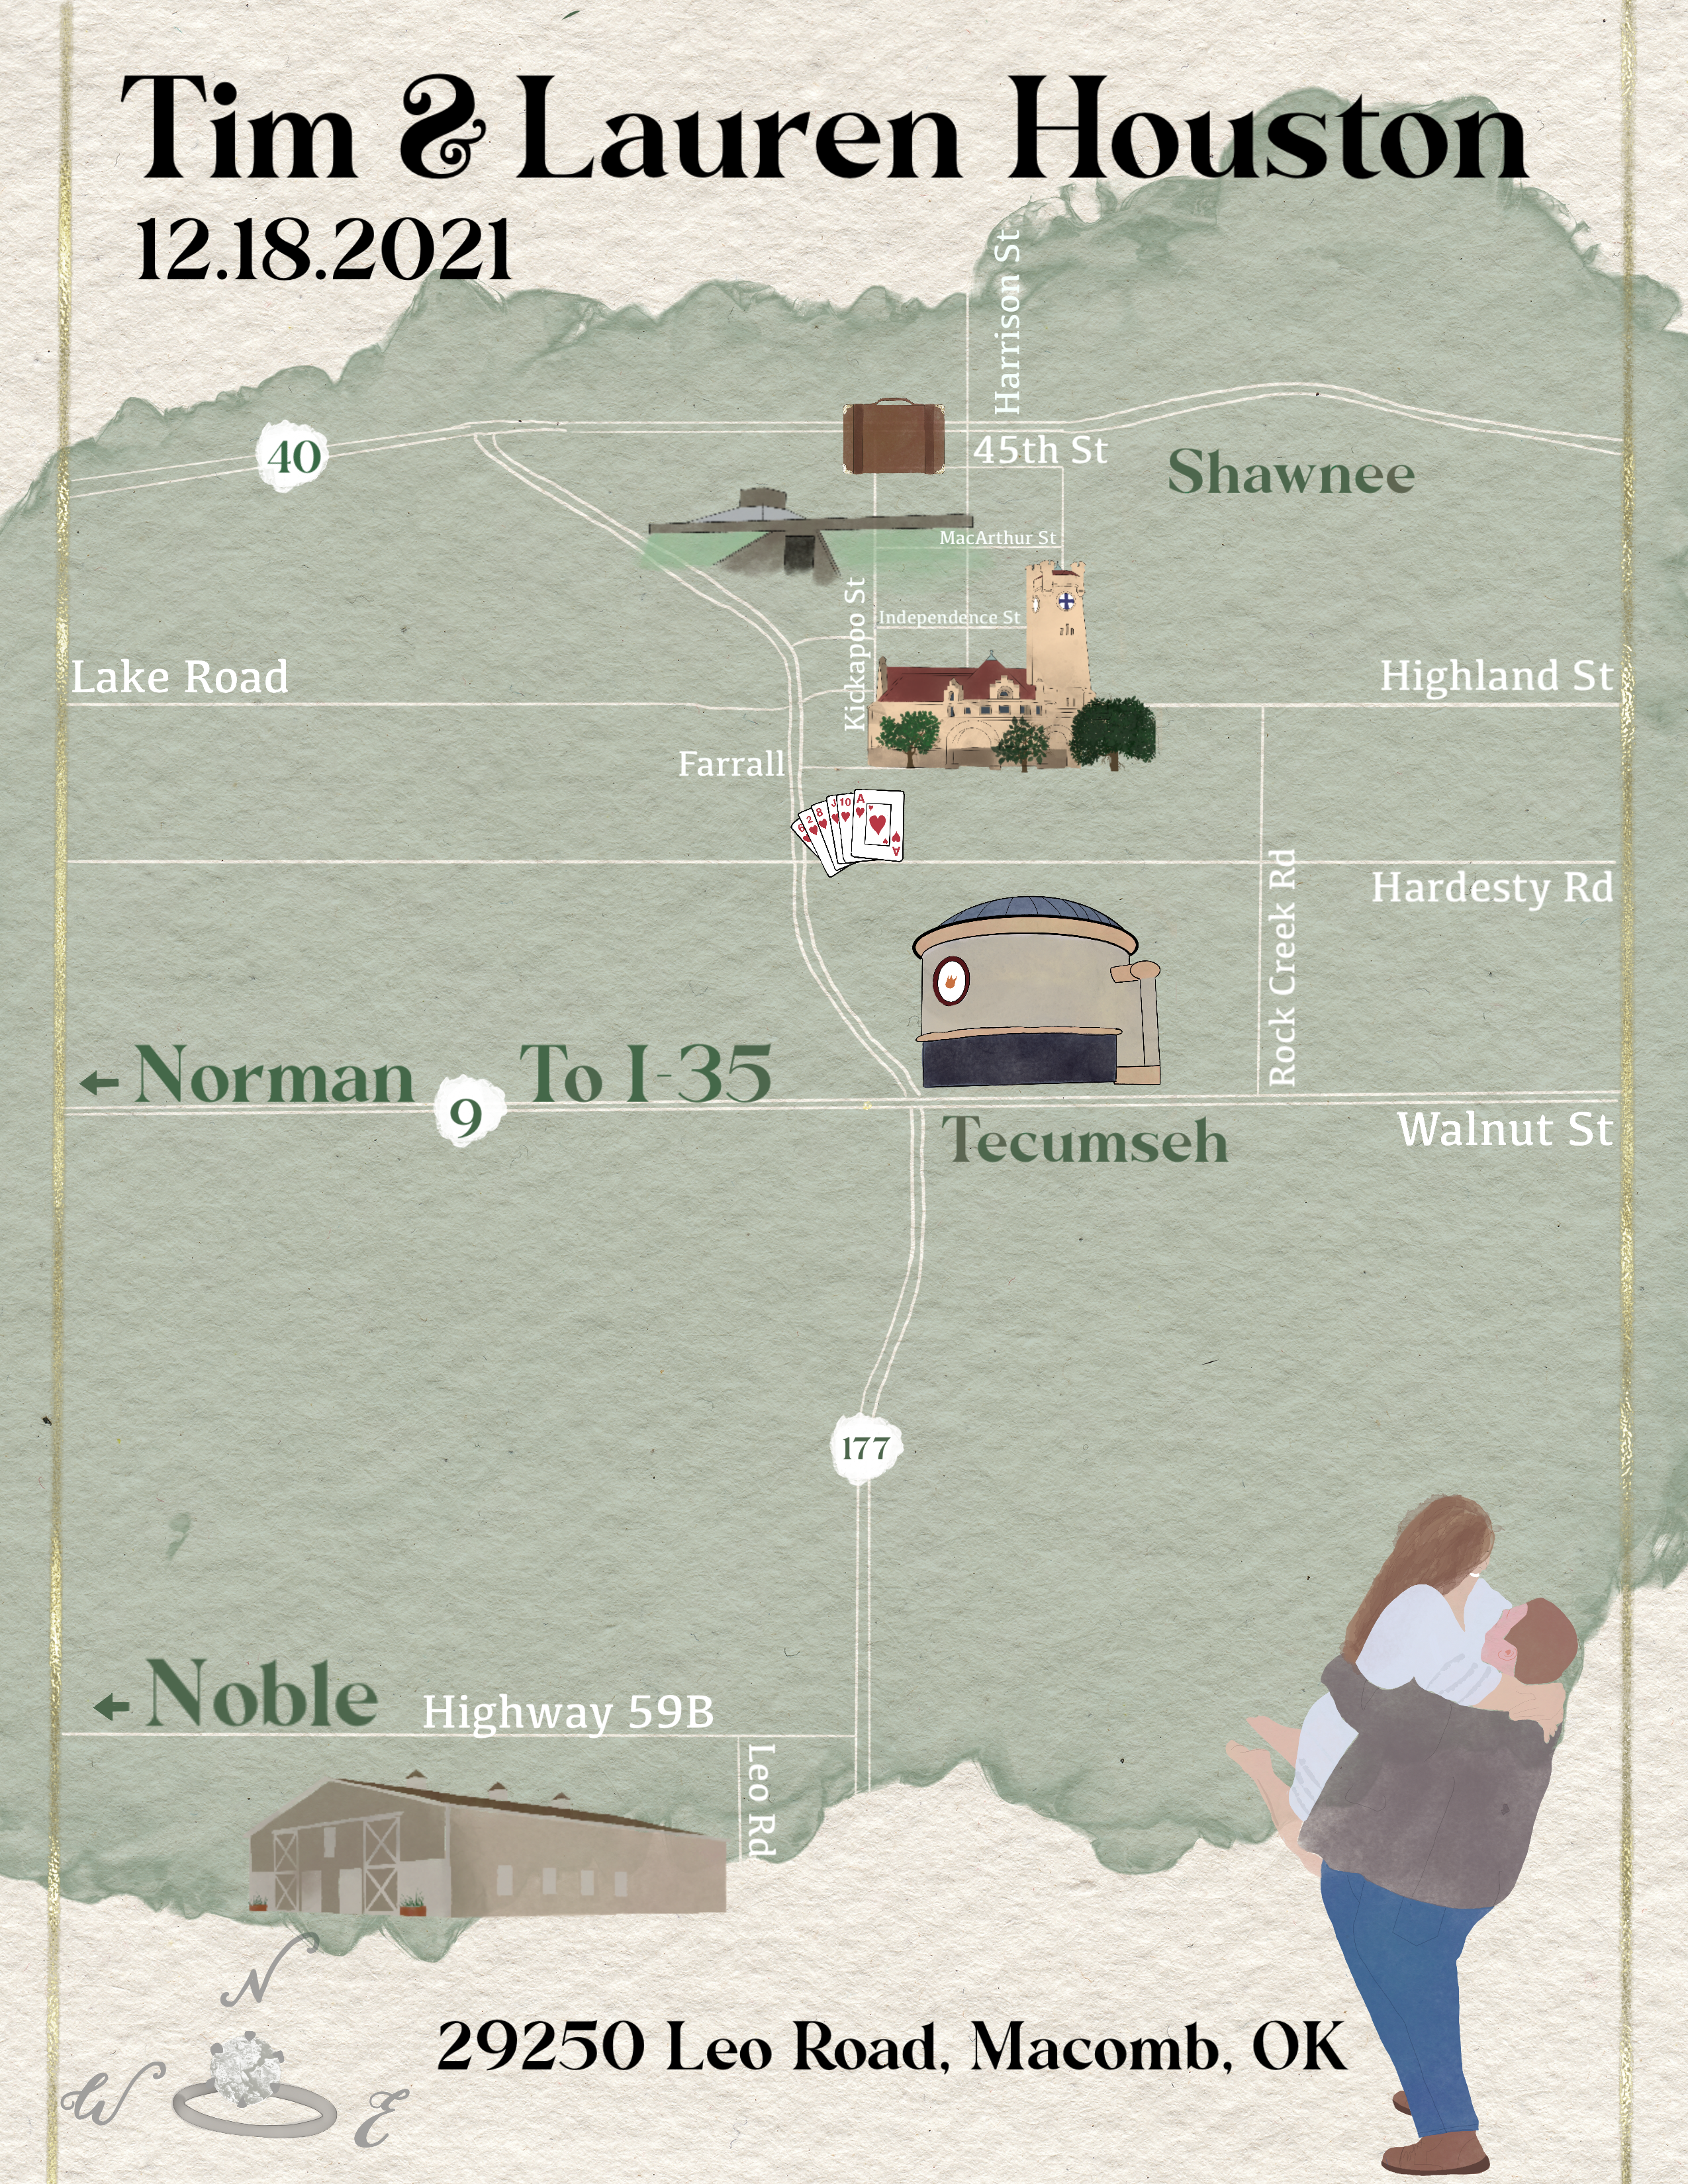
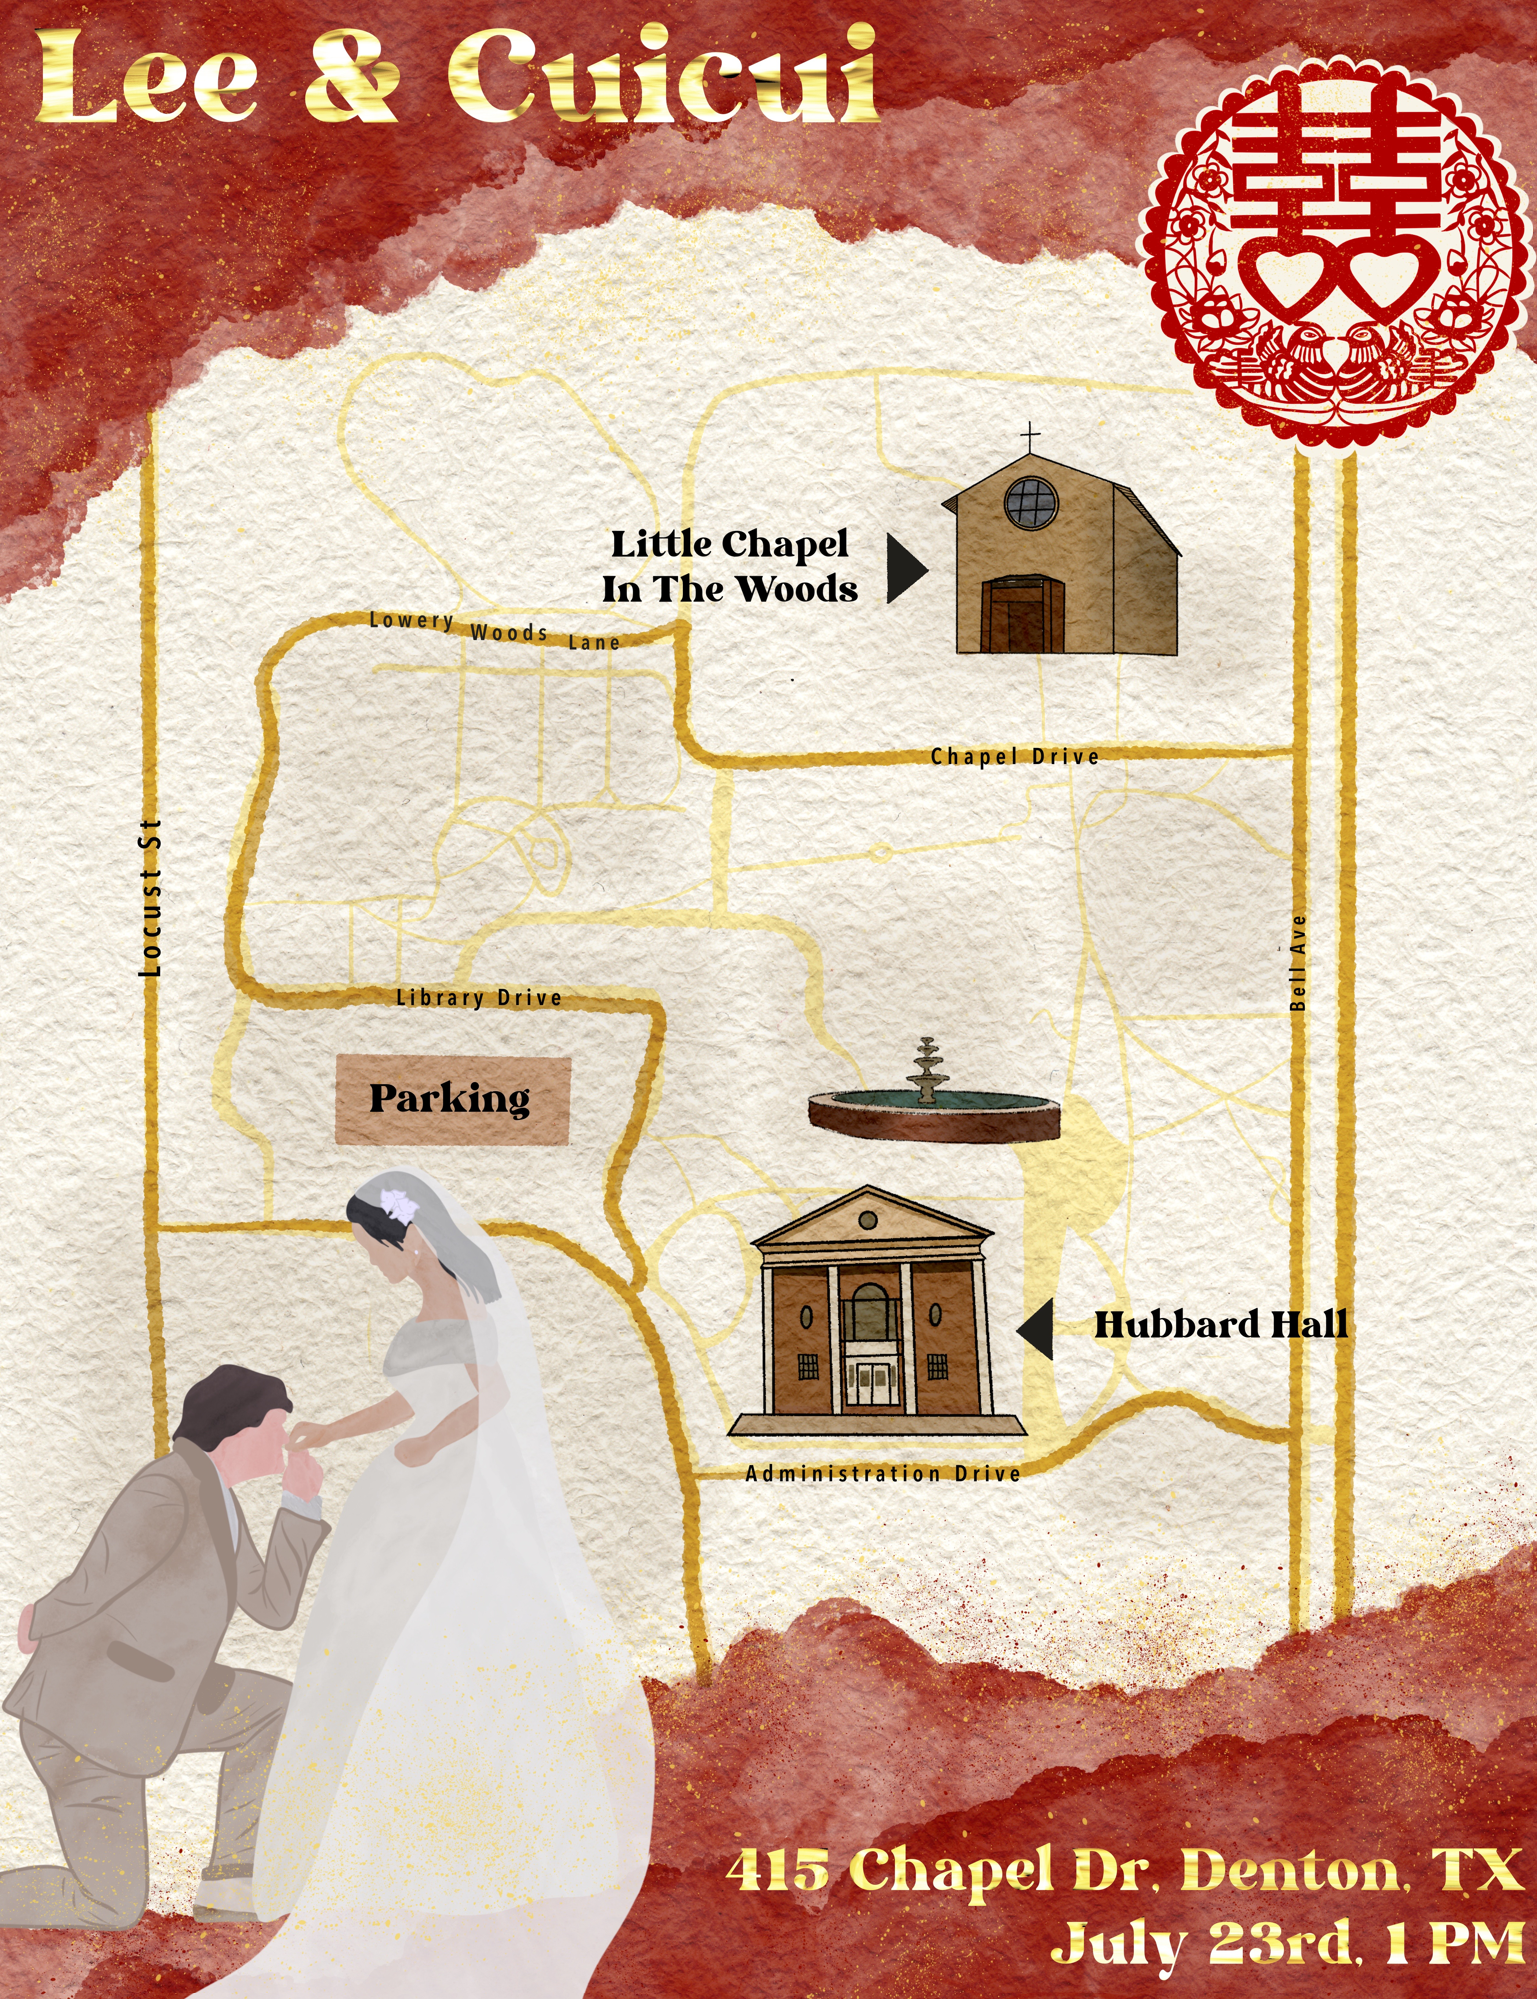
Maps to wedding venues have become incredibly popular. I was lucky enough to create these watercolor maps for my friends and family. This is the type of map that heavily relies on personal details, so being able to weave cartography and sentimentality into one project is always fun.
Close Project

Working in local government you interact with many diverse branches with varied needs. From the health department to the fairgrounds each branch has GIS requests. The maps above were created to communicate with the public and as such have a highly stylized design that calls back to that department and how they want to be represented.
Close Project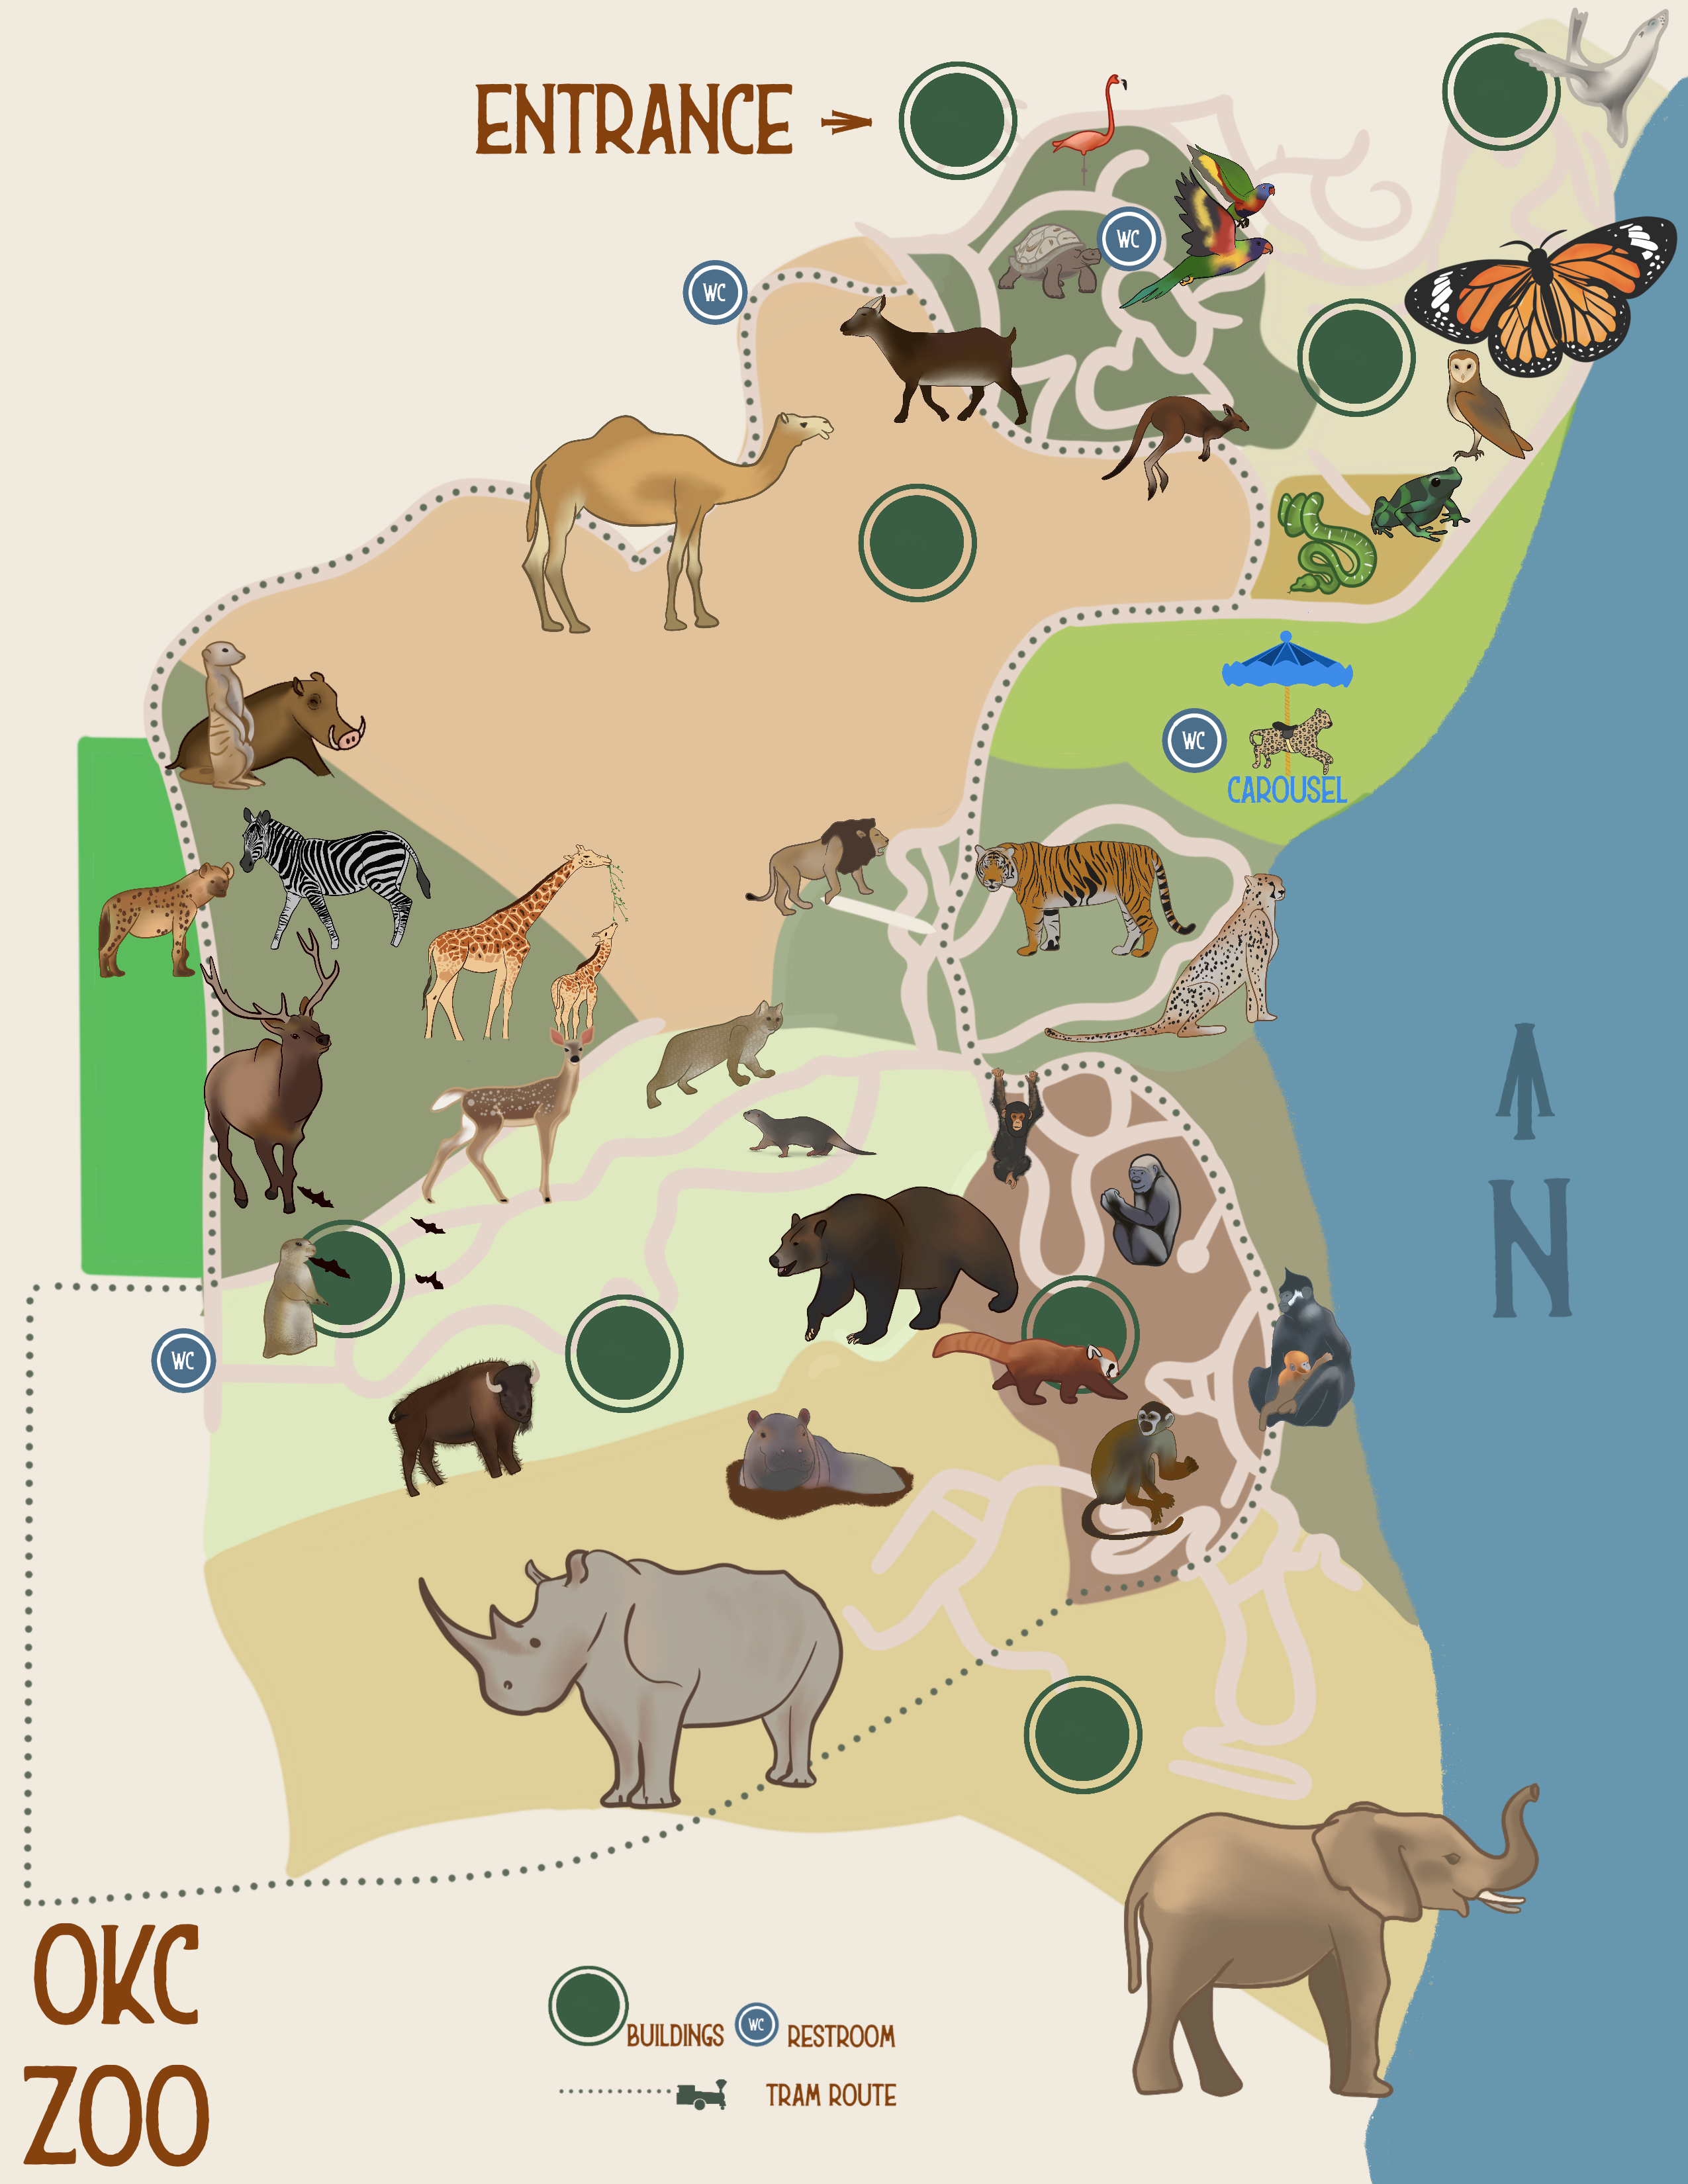
Maps rely on a fine line of communicating through text and imagery. This personal project explored that theme since many zoo patrons are too young to read. With that in mind creating an illustrated map was the clear choice.
Close ProjectCreating vivid and accessible maps for my local community allows me to expand my skill set while supporting causes I care about. In this case the community putting on events for pollinator week wanted a colorful and approachable map showing where and when their events would take place.
Close ProjectThis poster was created to show the decrease of the tallgrass prairie biome. This native region was easy to develop, and as a result only fragments of the native botany remain.
Close ProjectOf all my projects this one took the least research and the least GIS analysis to complete. It was simply created so I could work on my illustration skills. I found myself often being requested to make maps that went beyond my GIS capabilities, and veered into the realm of graphic design and illustration. Projects like this sharpen those skills.
Close Project
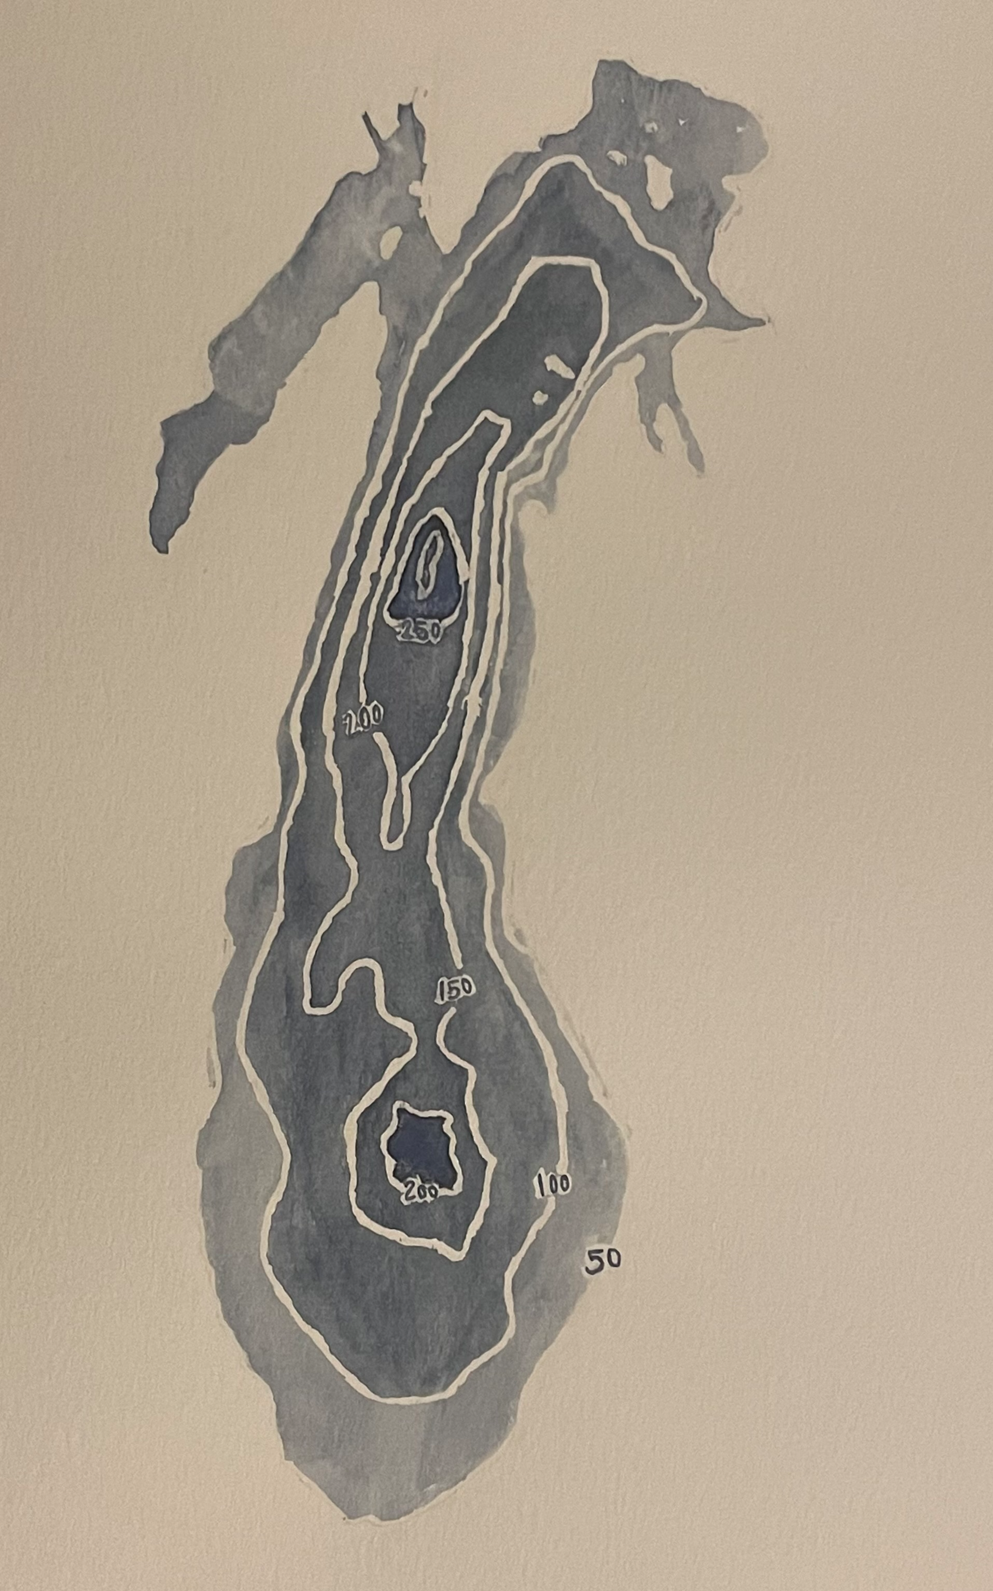
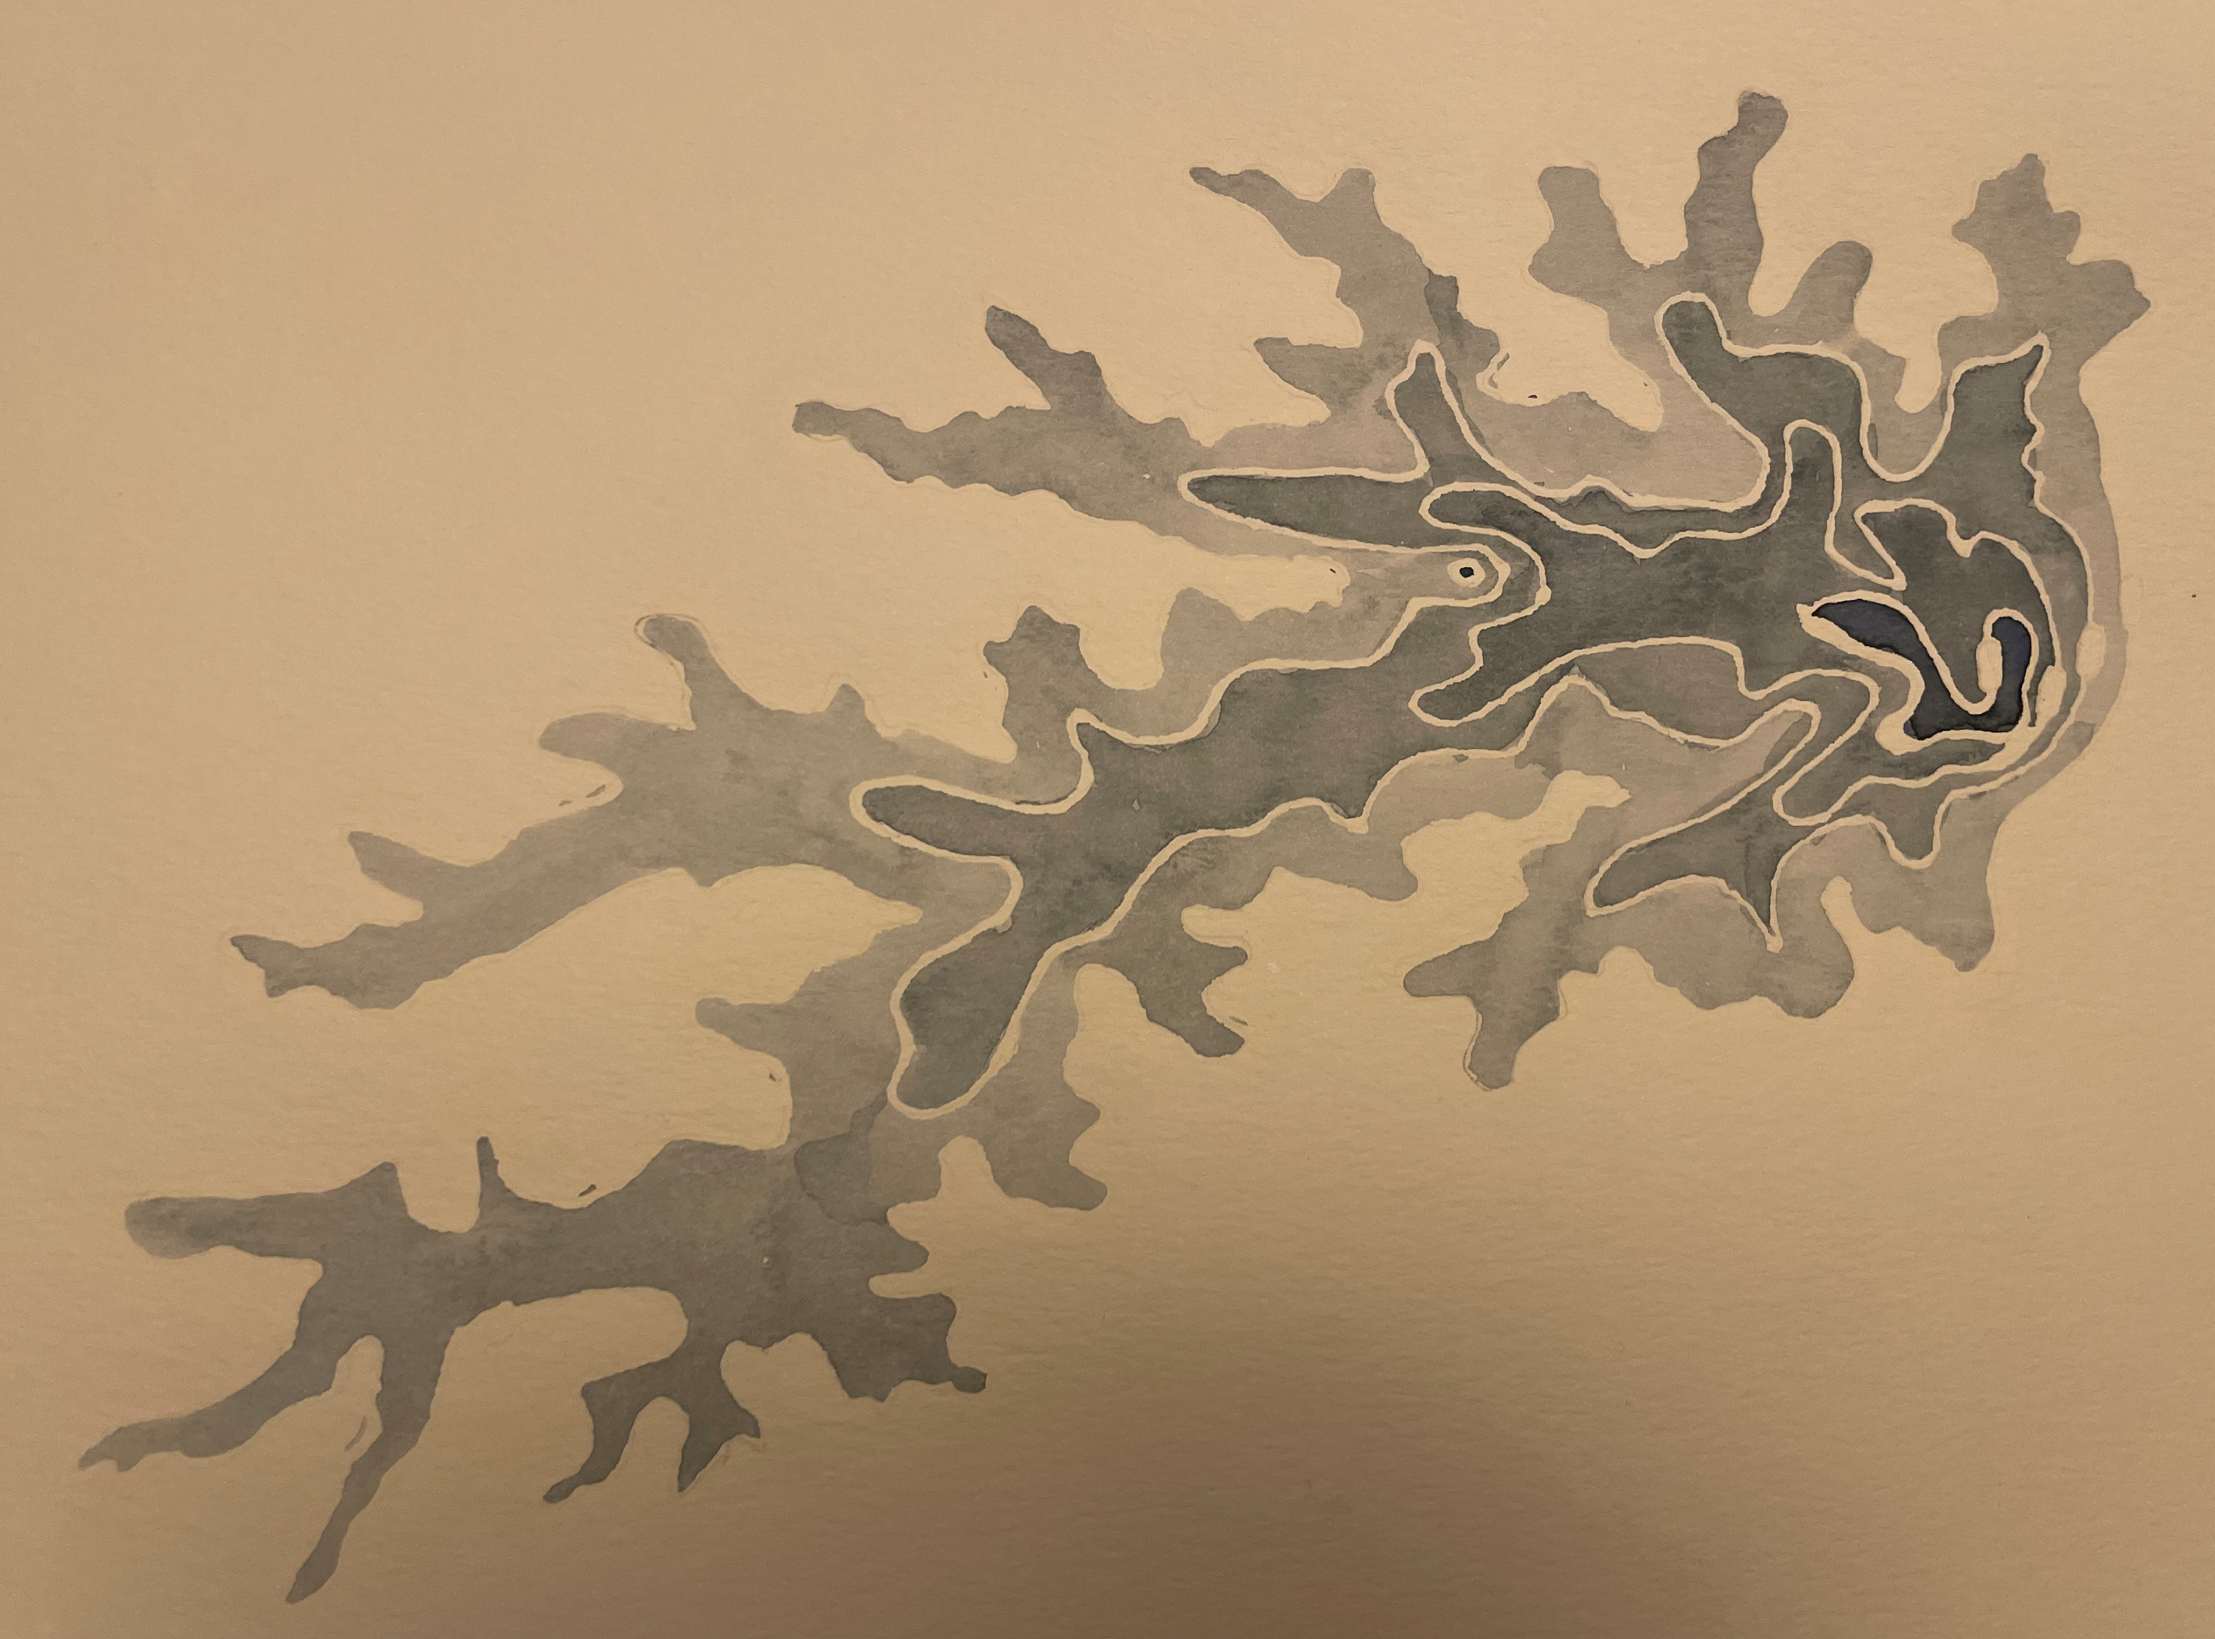
Taking cartography off the computer and onto paper is a fun activity that lets you get back to the roots of the discipline. I enjoyed getting my hands dirty by making my own watercolor paint out of local clay. I used negative space to highlight and define areas in my map to avoid a cluttered look.
Close ProjectWhen it comes to personal projects I love taking a DEM building it out into a well balanced and textured map. When I have spare time I will often do this to work with new color palettes and gradients.
Close Project
Every person who looks at the map of the world sees something different. I have always been drawn to the water. This projection draws attention to the bathymetry and rivers along side the land and the details it holds.
Close Project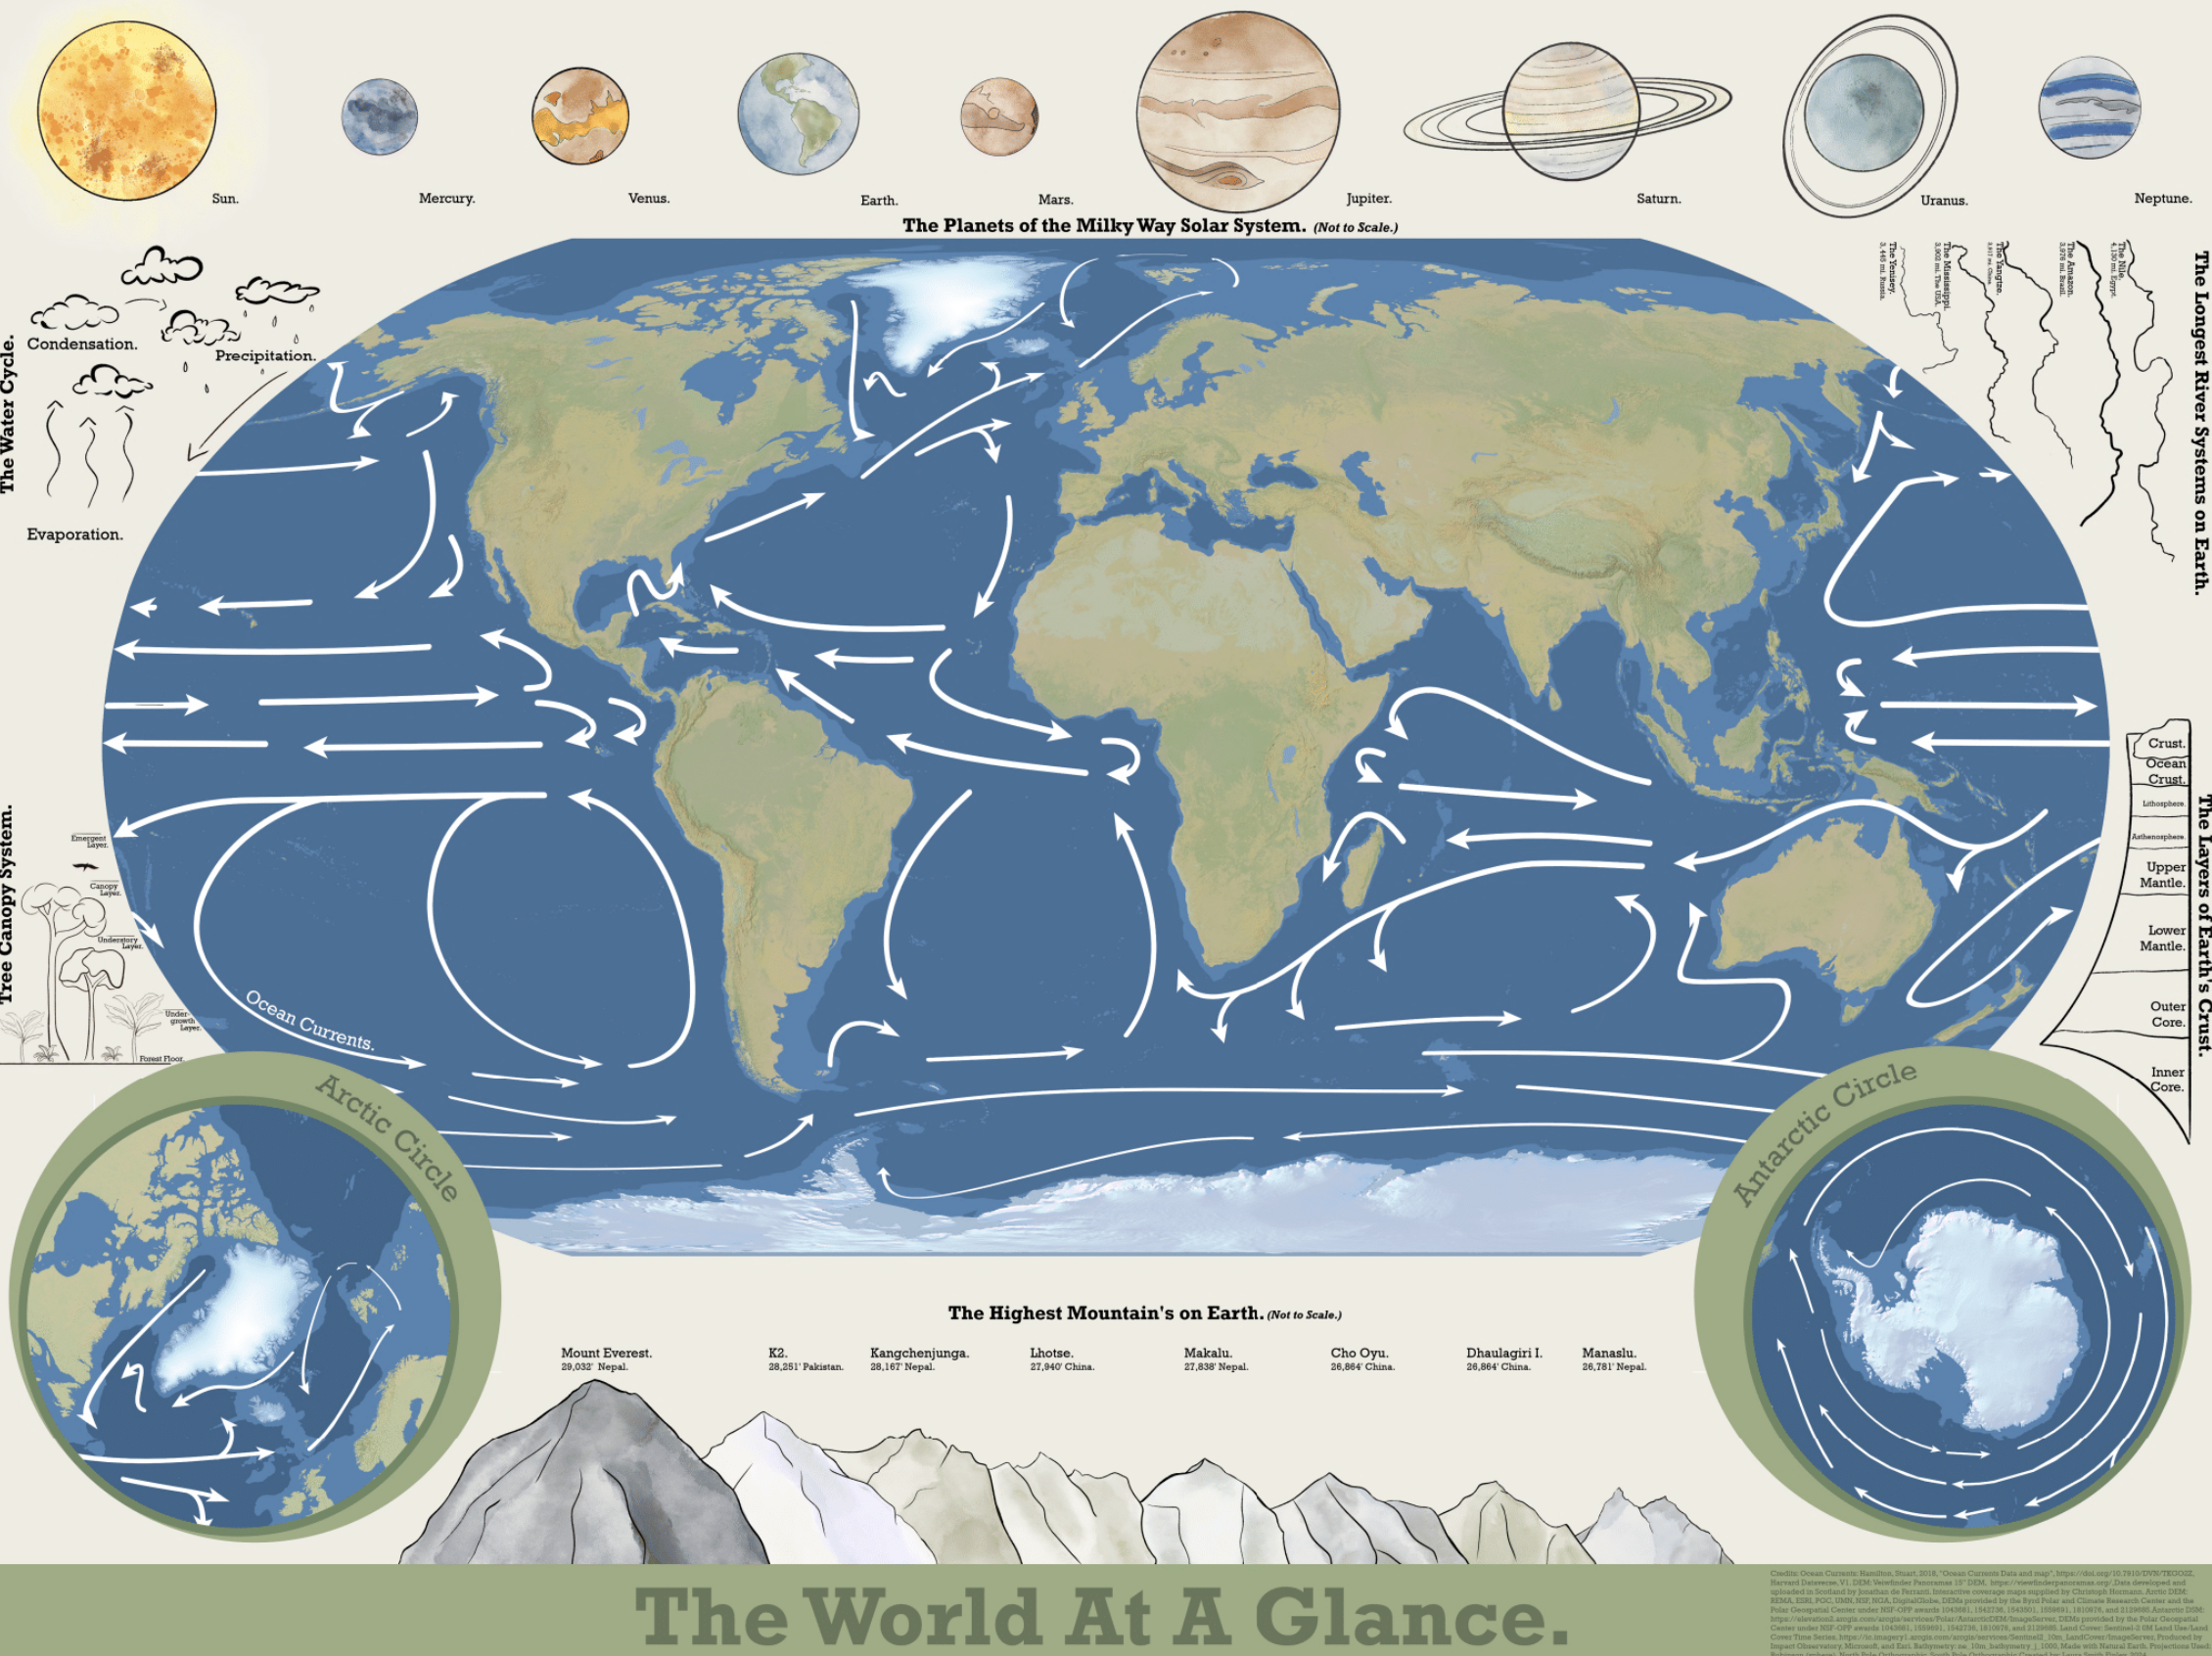
This map was created out of a love of old school infographics and a need for a world map. As a child I often found myself reading old earth science books and charts. This project was my attempt to use modern GIS technology to create my own version, packed with information about the world we live in.
Close Project